Category: Publications

Publication alert

Our research article, “Heat-related rest-break recommendations for farmworkers in California based on wet-bulb globe temperature” is out today, in Nature Communications Earth & Environment:
https://lnkd.in/gJK5MiFi

The heat season is around the corner and we are hoping that this paper will provide a starting point for discussing heat-related policies in California and elsewhere.

What did we do?

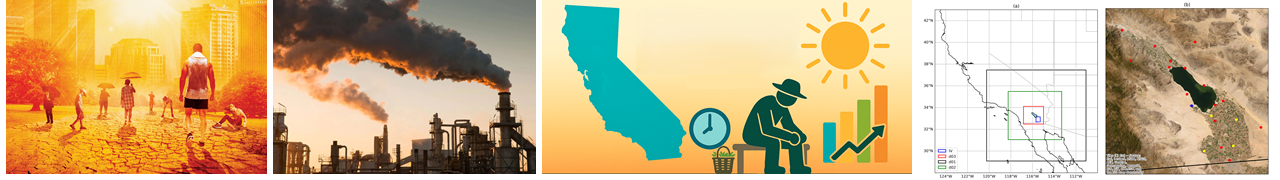
We determined rest-break requirements for the farmworkers of the Imperial and Coachella Valleys in southern California, using high-resolution outputs from a validated Weather Research and Forecasting Model (WRF) at 1-km grid.

How? Please be more specific.

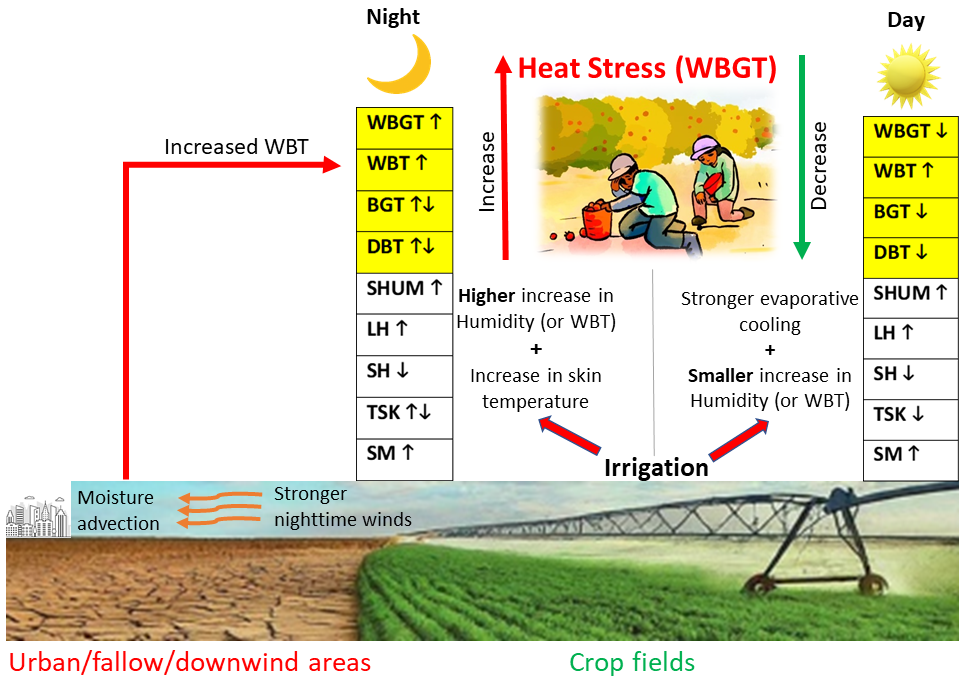
We calculated how often thresholds of heat stress indicators were exceeded in farmworkers’ working environments and translated those exceedances into rest breaks needed for their safety. We considered three existing policy guidelines that use wet-bulb globe temperature (WBGT), heat index (HI), or dry-bulb temperature (DBT) thresholds to specify rest-break requirements.

What is the finding?

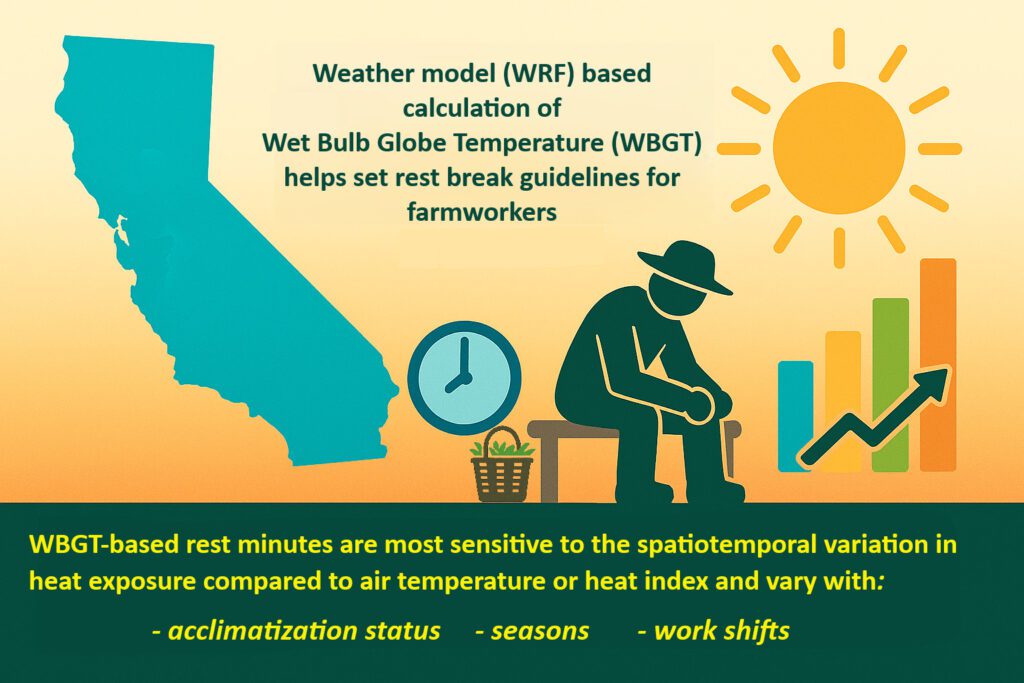
WBGT was the most protective among the three heat stress indicators so we used it to derive recommended rest duration considering the acclimatization status of the workers, seasons, and work-shifts. Recommended rest breaks range from 2 to 32 minutes per work-hour between April and August. These recommendations can be directly incorporated into regulations such as the California Code of Regulations (T8 §3395 CCR) or OSHA’s proposed new heat rule.

This is the shortest research article I ever wrote but it was the most satisfying experience. We talk a lot about interdisciplinary research but this is a real example showing how a marriage between weather modeling and the public health sector can create something totally new—a policy child. Thanks to our PI Trent Biggs for persisting on this idea.

Science progresses slowly so it is important to capitalize on the existing scientific knowledge for the benefit of society. That is exactly what we have done here—utilized available Earth science modeling tools, for developing policy guidelines, to protect lives.

On a side note, air pollution and extreme heat are two real issues we should be concerned about right now. More than 7 million people around the world die every year due to air pollution, which is now the second leading risk factor for death in children (after malnutrition). Another half million die due to extreme heat, the majority of whom are our own parents (called seniors in professional language). I continue to work on these important health issues using my skills in weather prediction and air pollution modeling. I welcome any collaborations on these issues.

Publication Alert: How does irrigation impact heat stress on farmworkers?

How does irrigation impact heat stress on farmworkers?

We answer the above question in quite detail in our freshly pressed article in Nature Communication Earth & Environment. It is an open-access article and thus freely accessible to everyone:

https://www.nature.com/articles/s43247-024-01959-7

We used a regional climate model (WRF) set up at 1-km resolution to calculate Wet Bulb Globe Temperature (WBGT), a standard metrics of heat stress, using ECMWF’s thermofeel python library, and examined the impact of irrigation on heat stress in Southern California’s key agricultural region, the Imperial Valley. Our main conclusions are:

1. Irrigation reduces heat stress in the daytime but increases it at night.

2. Urban and fallow areas adjacent to the cropped fields also experience increased heat stress due to moisture advection from irrigated areas.

Some background about this work

According to a recent OEHHA report, heat related illnesses among farmworkers are the highest in the Imperial County in the entire California.

Imperial Valley is not a small area, the entire county is a cultivated field. That is roughtly the size of 7, 37, 000 football fields. No wonder, Imperial Valley produces about two-third of the winter vegetables and up to one-third of the fruits and nuts consumed in the US.

There are nearly a million farmworkers employed in the Central and Imperial Valley region. They are exposed to high heat stress everyday as they get involved in various agricultural activities from planting to harvesting to packaging, between late Spring to early Fall season.

One of the unique thing about the Imperial Valley is that irrigation is heavily applied in its cropfields – thanks to the All American Canal built in the 1930s. The amount of irrigation applied here (~ 5 ft) is more than 20 times greater than its annual rainfall (~3 inches).

Given such a large amount of irrigation applied in its cropfields, a natural question came in our mind. Does the irrigation affect heat stress experienced by farmworkers? If yes, when, where, and how? We try to answer these questions in the above article.

Please stay tuned for what is next. We are working on a follow-up article in which we calculate rest-break requirements for farmworkers using the same high-resolution climate model outputs. We are trying to help redefine California’s heat related policies to protect the outdoor workers.

Hats off to our food producers, the toughest and the most resilient, the farmworkers!

Thank you for reading this! Merry Christmas and happy holidays to you all!

Funding for this work was generously provided by University of California Office of the President under the project Rural Heat Island:
https://lnkd.in/g5WVqWrf

Parajuli, S.P., Biggs, T., de Sales, F. et al. Impact of irrigation on farmworker’s heat stress in California differs by season and during the day and night. Commun Earth Environ 5, 787 (2024). https://doi.org/10.1038/s43247-024-01959-7

Powered by WordPress & Theme by Anders Norén

Secret Link