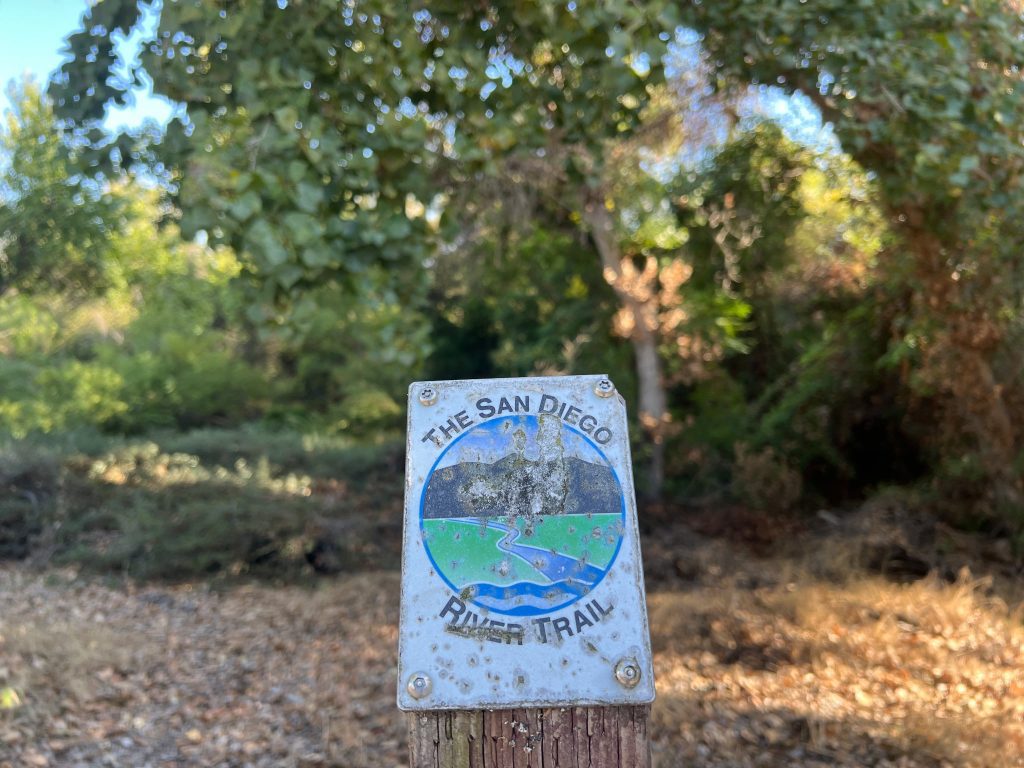
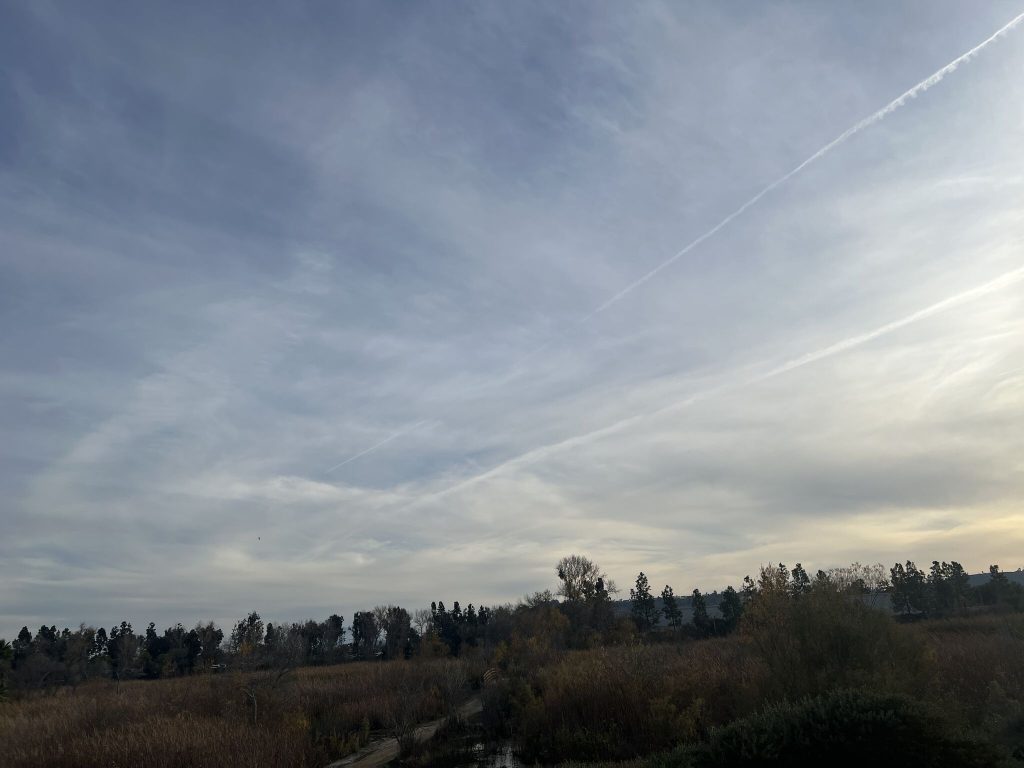
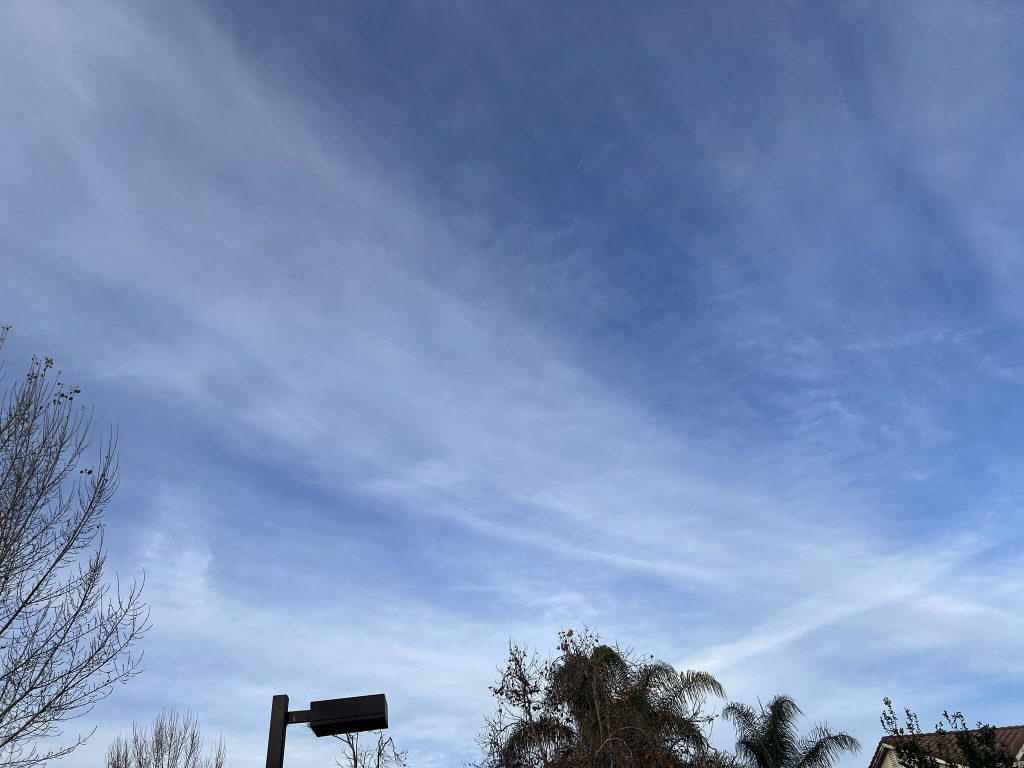
It was a nice, clear morning over San Diego on December 13, 2025, but by the afternoon the sky had filled with wispy cirrus clouds.
No storms! No expected clouds! No rain forecasts! But the entire sky looked feathery over San Diego.
People started talking about it. Some said they were chemtrails; they are poisoning our skies. Others said it was a regular winter sighting in Southern California.
What Is the Truth?
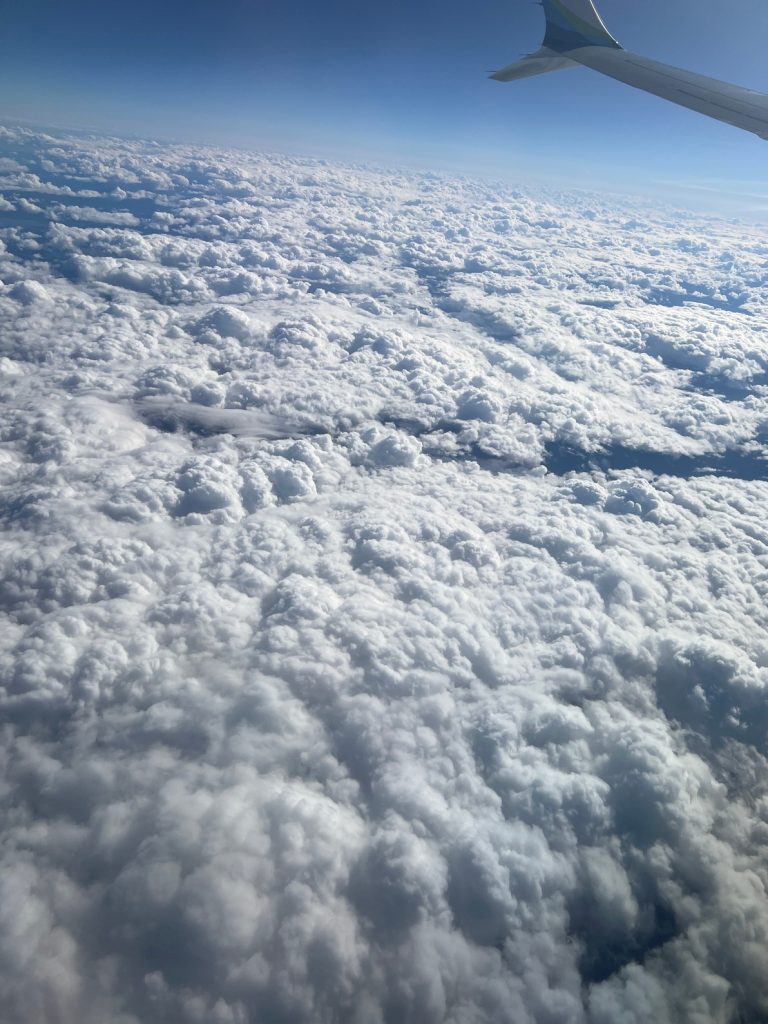
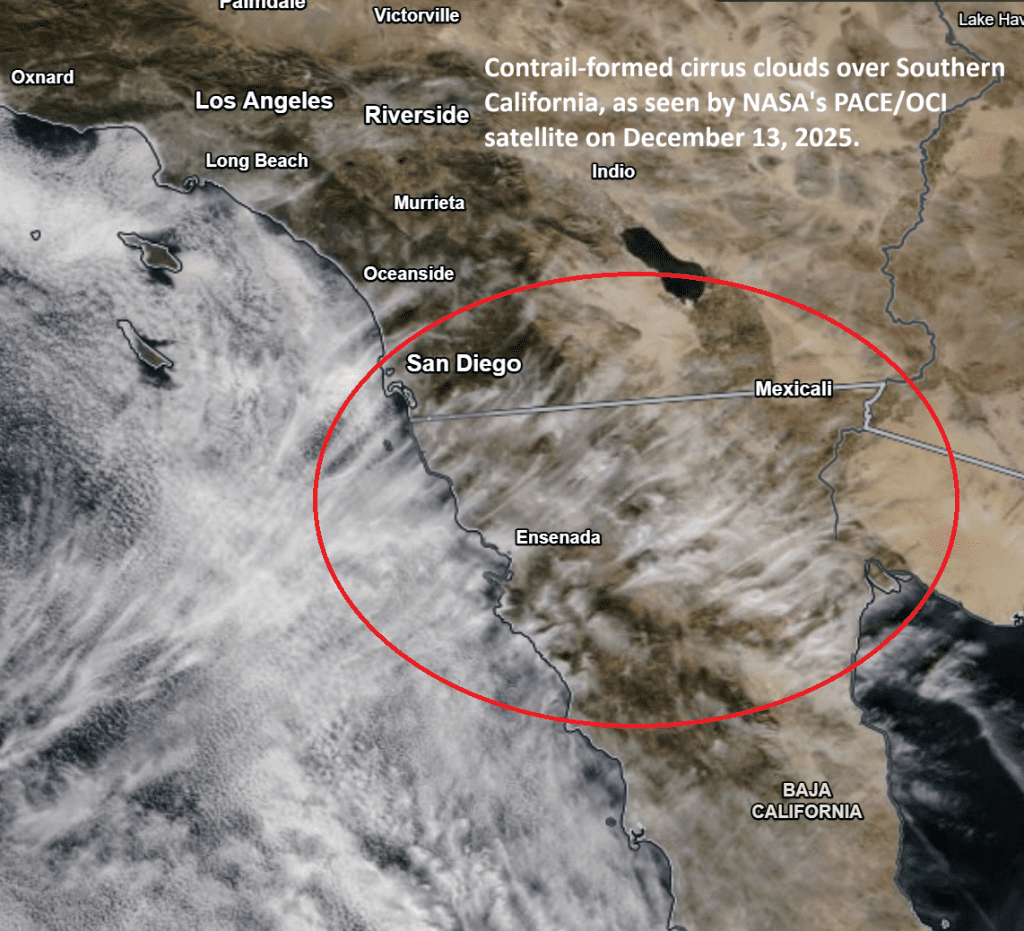
The exhaust from airplanes contains water vapor and aerosols, which instantly freeze when they mix with the cold air outside, forming thin lines of ice crystals that we call contrails. These contrails are more prominently seen on some winter days in Southern California when air high up is cold and moist. So the contrails do not fade easily; they grow and spread out, turning into thin cirrus clouds as seen in the picture. That is exactly what we saw on December 13 over San Diego’s sky.
If you don’t believe it, look at the radiosonde data for December 13. The clouds appeared exactly at the heights where jets typically fly (~9–10 km).


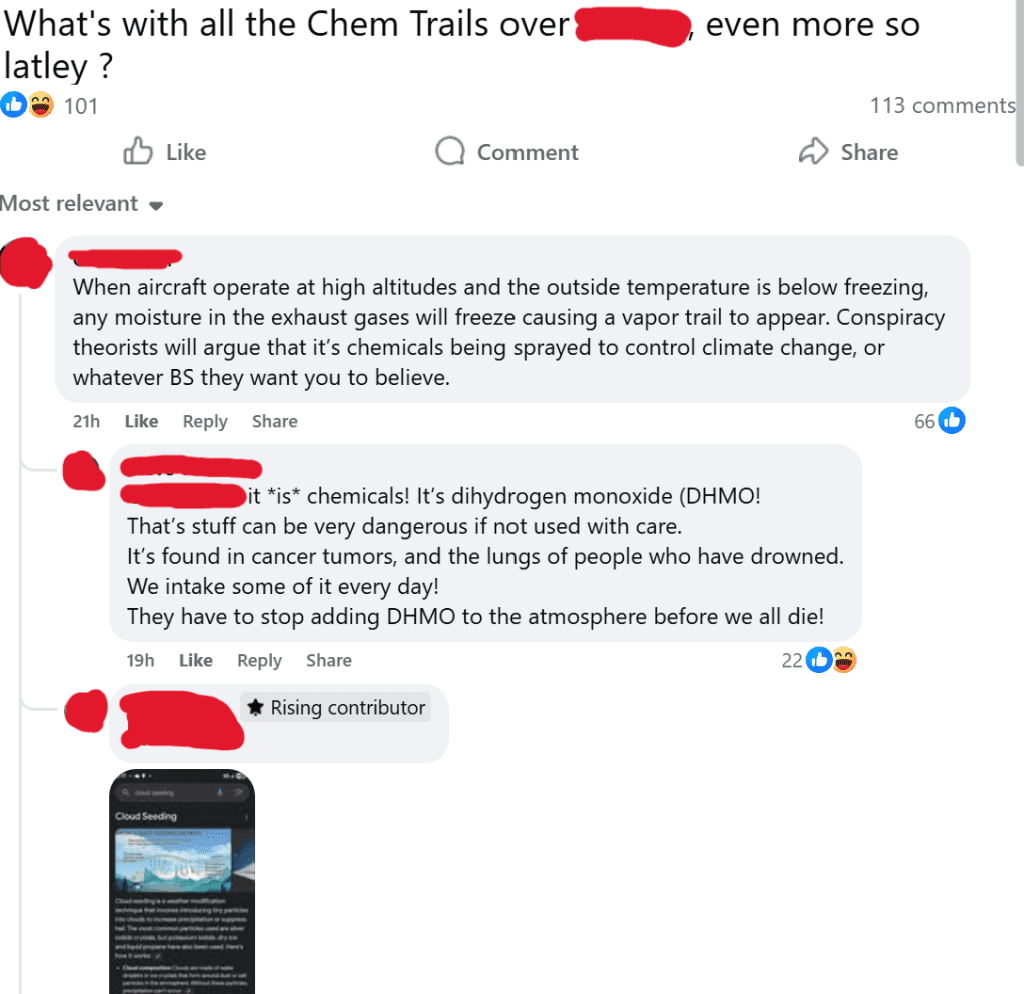
Was It Cloud Seeding?
No, what we saw over San Diego was not cloud seeding, nor were they chemtrails as some people believed.
However, cloud seeding is real, and it has been carried out regularly in California since the 1950s. In cloud seeding, aerosol particles like silver iodide or dry ice are injected into suitable clouds to increase rainfall. These particles provide surfaces for the condensation of water vapor (like how dew drops form on a glass window), so they can increase precipitation under some conditions.
For example, the Santa Ana Watershed Project conducted cloud seeding experiments in 2023/2024 and discontinued the program because it did not increase rainfall as expected.
Similarly, the County of Santa Barbara continues to carry out cloud seeding operations because their results have shown up to a 20 percent increase in precipitation.
Learn more here:
https://www.countyofsb.org/2548/Cloud-Seeding-Precipitation-Enhancement
https://sawpa.gov/santa-ana-river-watershed-cloud-seeding/
Do Contrails Modify Earth’s Climate?
Yes, they do!
Cirrus clouds, including those formed from contrails, consist of ice crystals that absorb thermal radiation emitted by Earth’s surface. As a result, they warm the atmosphere.
To What Extent?
About 45,000 flights occur every day over the US, so they certainly modify Earth’s atmosphere in a significant way.
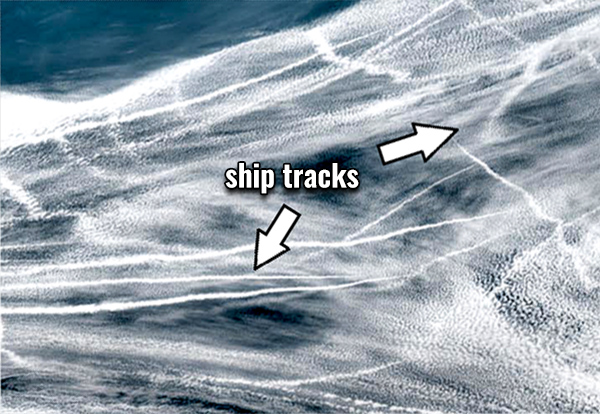
What About Exhaust From Ships?
Similar to contrails, ship tracks are also common over the ocean. Ship emissions contain sulfur dioxide, which gets converted to sulfate particles. These sulfate particles reflect sunlight, which is why ship tracks look white in satellite images.
Because they reduce solar radiation reaching the surface, they cause a cooling effect beneath the clouds.
Several research papers have shown that ship emissions significantly cool Earth’s surface. However, the IMO regulation (2020), which reduced the sulfur content in marine fuel by 85 percent, has weakened this cooling effect and may even have caused some warming at the surface.
Final Thoughts
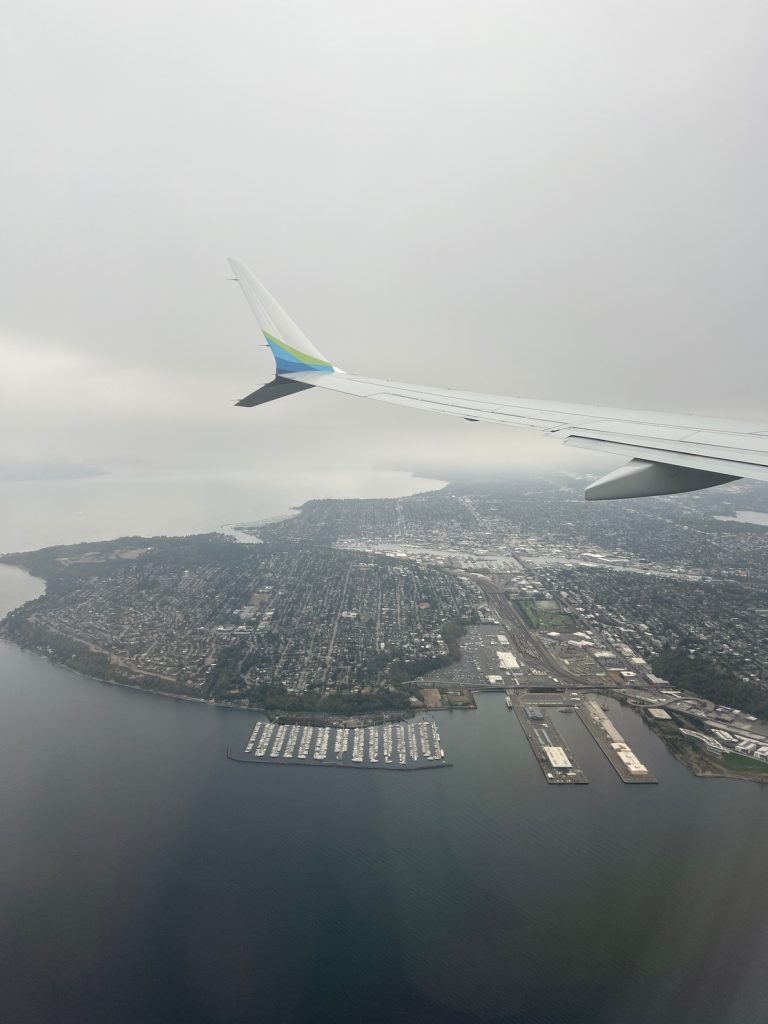
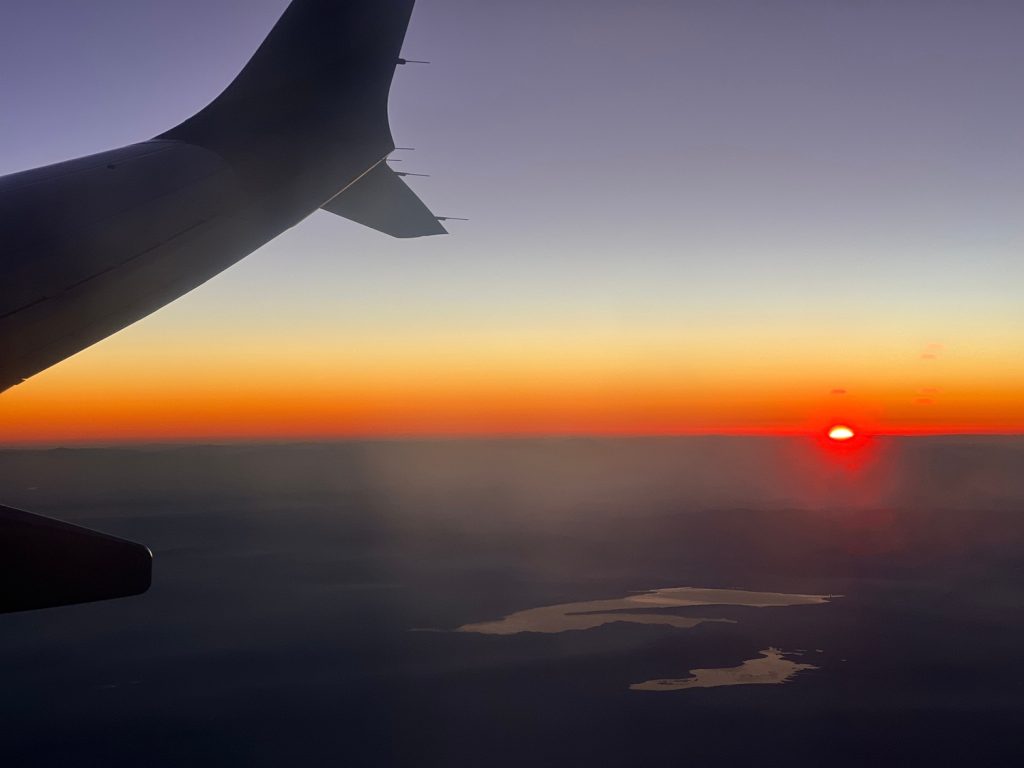
That is all! Leaving you with some pictures that I took on December 13, 2025, over San Diego’s sky. Thank you for your attention!