Extreme heat and air pollution kill!

Category: Blog Posts

See you at the California State Capitol!

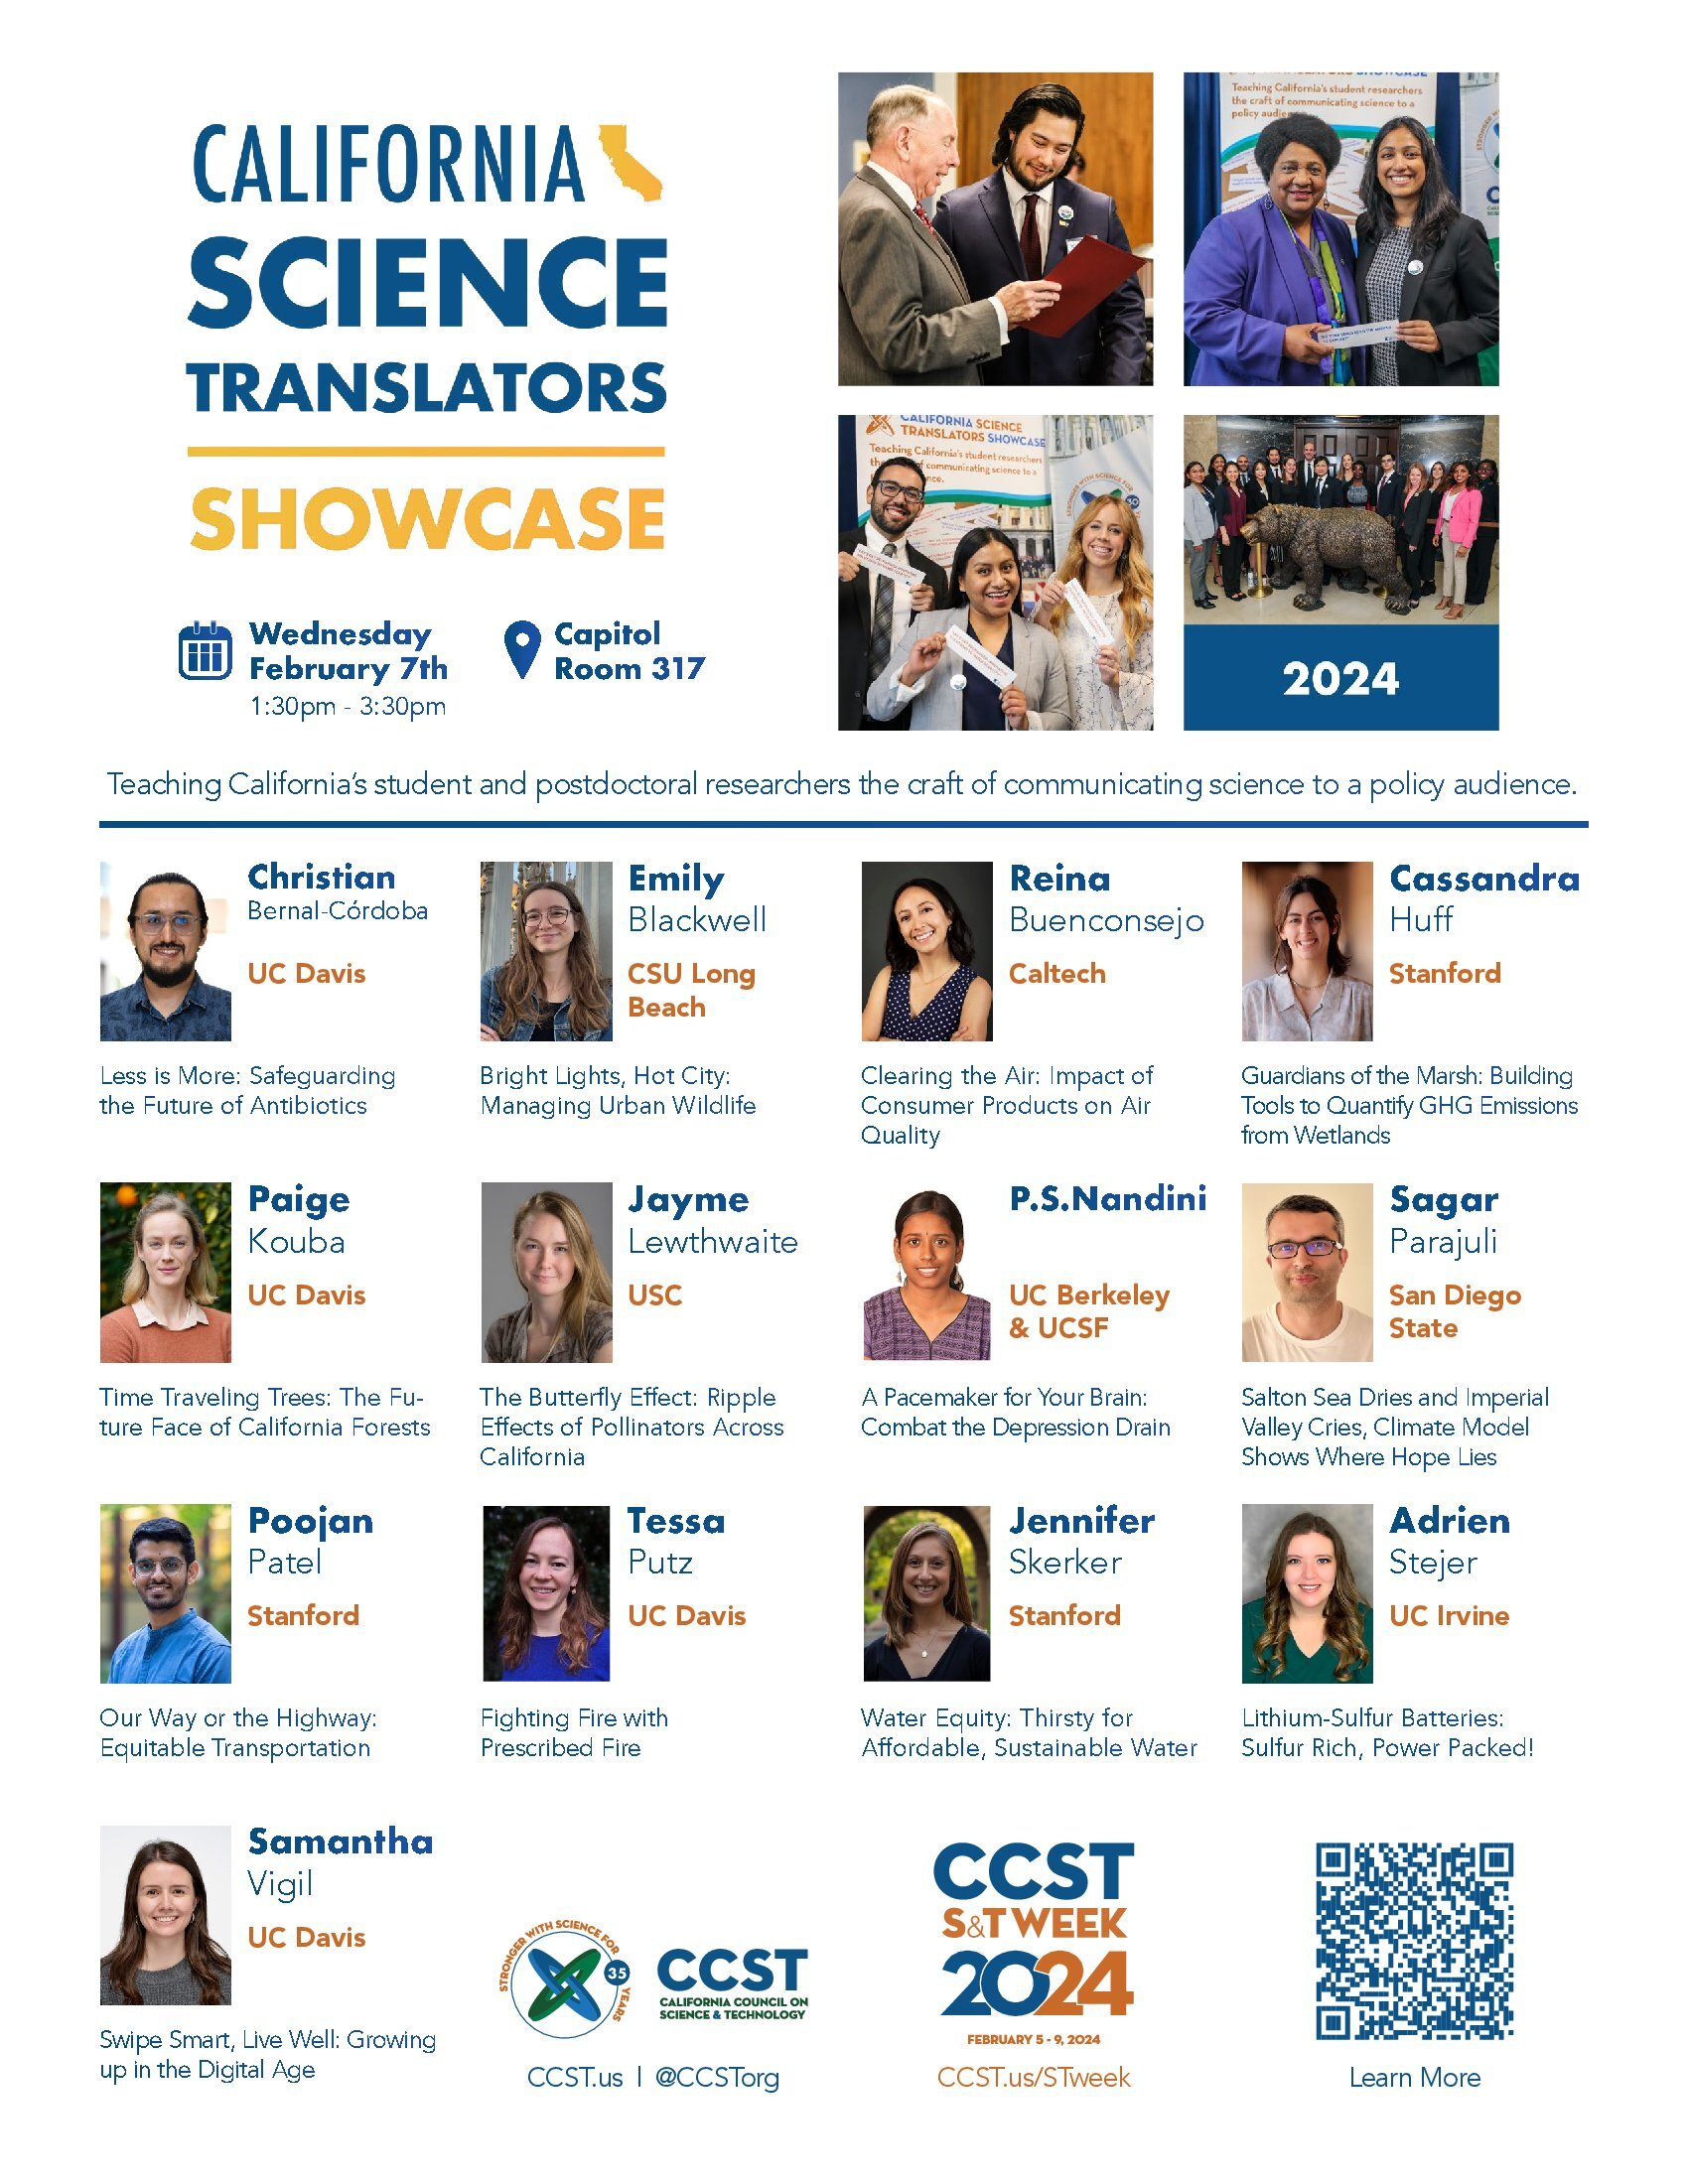
My application for the CCST Science Translators Showcase 2024 has been accepted (with travel support).

CCST Science Translators Showcase is an annual event organized by California Council on Science and Technology (CCST), which is a non-profit organization that aims to inform California’s policies through science and technology.

As part of this program, the final 13 candidates selected will get a chance to explain their research to legislative staffers, agency managers, and senior policy leaders during a networking event at the California State Capitol. The candidates are also provided with trainings to effectively communicate science to policymakers and their staff before the event.

If you want to know what I will be presenting at the event, here is a link to a 60-second video that I created as part of the above application.

The event for this year is scheduled for Feb 07, 2024 at the California State Capitol! Hope to see some of you there!

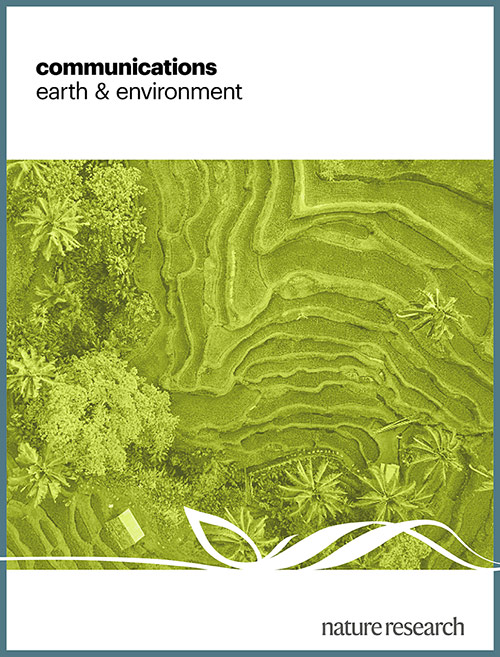
Joining the editorial board of Nature communications earth & environment

I have recently accepted an offer to join the Editorial Board of the Journal Communications Earth & Environment as a member starting this July. Communications Earth and Environment is an emerging open-access journal from the esteemed Nature Porfolio. I am very happy to join this particular journal because I value life and I care about the wellbeing of our planet Earth.

I hope to contribute meaningfully in uplifting the quality of this journal while also encouraging authentic research works that address the widespread problem of air pollution and degrading Earth’s environment. There is no doubt that, whatever be our research objectives, we must support the wellbeing of our Planet Earth and its biodiversity.

Please consider submitting your article in this open-access journal from Nature Portfolio to increase the impact of your work.

Long live our Earth and environment!

Did you know?

Nature partially pays to their editorial board members.

PhD: concluding remarks

When I was a kid, I never dreamed of earning a PhD. All I wanted was to study more and more. So I just followed the course of the river. I didn’t know or care whether the destination is ocean or something else.

When I became an adult, I knew that the society where I was brought up highly revered a PhD. So I had thought that I will also some day do a PhD.

We can plan something but not everything. That is what I have experienced. PhD thought came into my mind when my supervisor at Masdar Institute came to my desk one day. He showed a small ad in an AGU newsletter about a PhD position at UT Austin. I didn’t want to let down my supervisor so I applied. In fact, that was the only place where I applied. Until then, I had only thought of returning back to Nepal and rejoining my low-paid but highly revered ‘engineer’ position. I was not sure about it even after I got the offer. I really didn’t know that UT-Austin was a good ranking Tier 1 university until I posted about this offer in my Facebook page. The comments reflected that UT Austin is a great place. My perceptions got changed. I decided to pursue.

I was about to give up soon after I started my research at UT Austin. I was hit really hard in one of the group meeting. Not only by my supervisor but also by my colleagues. I felt the lowest of my life on that day. But soon I realized that it was because the standard and quality of research was much higher than I expected.

I was very busy taking 3 courses at that time and it was very hard to manage time for research. A few colleagues had already failed in their qualifying exams. So I many times felt that it was a wrong decision to pursue a PhD. My health was also not favoring me; I had been diagnosed with celiac disease (allergic to gluten). I very much regretted for leaving my government job of an Engineer back in Nepal.

10911231_10155054074510099_6469084610772877450_o

So there were only two options. Do or die. It is the same thing but a different tone is used in research: publish or perish. But as I interacted more and more with my colleagues and knew about research, I realized that we all were on the same boat. So I decided to continue. I worked harder. Time was not a problem for me because I was married single at that time. Weekends and holidays then meant more research. No wonder, my eye power kept on increasing at a rate of 0.25 per year.

Things started getting better. Qualifying exam was a great success.

I was still not comfortable in the world of research. I tried to avoid people who criticized my work. But later I realized that I can’t escape anywhere in research. You can’t escape your peers. You can’t escape your experts in your field. Most importantly you can’t escape the reviewers of you papers. It took little longer for me to realize that such interactions, feedback, comments, etc. are actually good things.

I never thought that I would be able to graduate in three and half years. But it happened. I worked hard and it got reflected. One of the reason for this success is also that I didn’t waste any of my work at UT Austin, not even the class projects. I always kept the main research topic in my mind before I started any class projects. So all of those activities later became part of my dissertation.

My daughter was born in the last year of my PhD. And the degree of ‘father’ means no less than PhD to me. Indeed, graduate study is when many people get engaged, married, or have their first kids.

13048166_10156764400375099_1719687007500413925_o
With my adviser(to my right), co-adviser(to my left), and examination committee members after the defense on April 15, 2016.

The most important thing that I realized during my PhD study is that learning is a never-ending process. Initially, I really thought that research is or has to be flawless. But I was totally wrong on that. There can be many flaws in your research. That is exactly why we discuss the limitation in the end of a research paper. PhD makes us understand this reality in depth.

I also realized that we can’t be successful in PhD just by gaining knowledge. We have to develop some conscience too. Knowledge without conscience is indeed dangerous.

When I was a child, I believed that if something is written in a text book, it must be true. I believed everything I read in a book. But now, I trust nothing other than my conscience. I now not only buy the conclusions of a research but the wholeness of it, with its limitations and assumptions. After all, a theory is only true until the assumptions are true.

In our research, we try to model the earth system. Modeling the earth system is indeed overwhelmingly complex. Even a grain of sand is very much complex to model, let alone the whole Earth. We must simplify many physical processes. We have to make many assumptions. So sometimes it can be frustrating too. But the beauty of research is that we understand little more everyday than yesterday. The beauty of research is in seeking, not in gaining something.

13288124_179159015813437_1353670647_oWith my wife Sirjana and daughter Nova on graduation day, May 21, 2016.

As I look at my Tam hanging on the wall, my heart leaps up with pride realizing that I received the highest degree possible in an academic world. But as I look out of the window and see the wonders of the nature, my heart bows down realizing that there is so much more to explore. I am still not sure how much knowledge I gained during my PhD but I know with certainty that I know very little.

Finally, what does this degree really mean? This degree reflects the knowledge of many people, knowledge that is passed down through generations. I am merely a carrier of this knowledge. It also reflects the aspirations of many people; my family, my teachers, my friends, and many anonymous others. It is an outcome of their good wishes.

Post originally posted on May 23, 2016. 

Satellite data: an overly underused resource

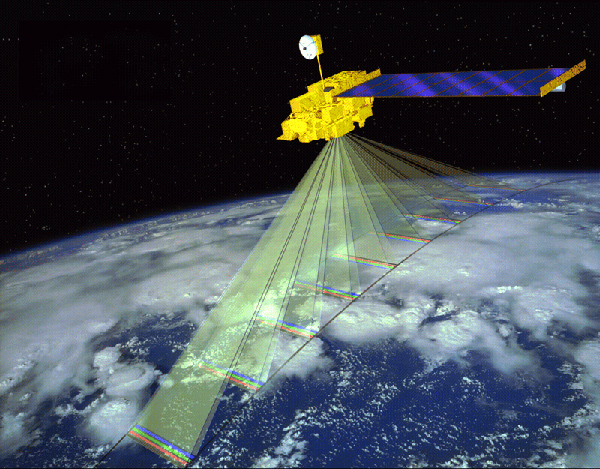
Satellite data have greatly contributed in improving our understanding of Earth’s climate. We have several climate models but, without satellite data, we don’t know how they are performing. Without the satellite data, we don’t know how far is our imagination from reality. Satellite data provide us the realistic boundary conditions. Without the boundaries, our theory may easily turn into a fiction.

satellitesai.jpg

Several satellites fly above us everyday. They are watching us. They are recording our behavior. They are indeed CCTV in large scale. They are recording human activities. We have done many things unconsciously in the past. We have emitted environmental pollutants. We have polluted ocean and water bodies. We have cut down trees. But now it is all documented. If you emit pollution or exploit natural resource, you may have to appear in the court one day.

A lot of data has been generated by various satellites. There is a lot of data. Tremendous amount of data. But, unfortunately, only a fraction of this data has been really used, for some useful purpose.

Take an example of surface reflectance data which are available from MODIS and other satellites. Reflectance basically measures how the surface properties change over time. In fact, Earth’s surface records a lot of things, much more things than what you think right now. When it rains, it gets recorded. When the surface gets dried, it is recorded. When it is very cold, it is recorded. When it is very hot, it is recorded. When a hurricane happens, it is of course recorded. When there is flooding, it is indeed recorded. When an asteroid falls, why would it not record it? Deforestation is surely recorded. Even information about day, night, and Earth’s rotation all are recorded. What is not recorded? Everything. Just everything. In a single reflectance data, you will find everything you need. You just need to change your perspective. You will see a lot of information hiding in the data set.

It is only because of our poor creativity that we are sending satellites one after another. Otherwise, we can extract myriad of useful information that we need just from a single data set. We just need some skill to decode that information. We just need a creatively advanced algorithm to extract the required signal from the data. We will benefit more from our satellite data if we spend more time developing algorithms that can extract the various useful signals in a data set.

The possibilities of using satellite data are endless. We just need to be creative. Do not search in Google Scholar for what others have already done with the data. If you do so, you will only reproduce what others have already done. Ask yourself. How can you use the data to manifest your inner passion? Think differently. Creativity will emerge, from within you.

Who said that vegetation data can’t be used to study the fires? We just need to understand the connection. Creativity is within us. To be creative, we have to believe in our own capacity first. The only difference between we and Einstein is that Einstein believed in himself but we didn’t. The exact same intelligence resides within each of us. It is only a question of how much we allow it to come out. To the one who believes in himself/herself, possibilities are endless.

How to write a great research article?

Slide1
Slide2
Slide3
Slide4
Slide5
Slide6
Slide7
Slide8
Slide9
Slide10
Slide11
Slide12

How to process and visualize MODIS data in MATLAB

In an earlier post, I talked about how to download MODIS data in NetCDF format. Now I will tell you how to process the downloaded data in MATLAB.

Note that there can be be data outages on certain days so you might see less data than expected. For example, MODIS Aqua data for the year 2008 will have only 364 days of data although 366 (2008 is a leap year) is expected. Check the day stamp in the file name to know exactly which day is missing. I will be processing the 2008 data below. Further, I have noticed that on certain days (2-3 days in a year), the filenames are extra long with some added information during data processing in Giovanni. If you see such unusual names, you have to manually rename the files to make the names consistent with other files.

Read data

  1. Copy all the files in your MATLAB workspace.
  2. Since there are so many daily files, we need to read all the files using a loop. So follow the following steps:
file_names = dir ('*.nc'); % extract filenames and associated information
num_files = length(file_names); %num_files in this case is 364

deep_aod = zeros (360, 180, num_files); % 180 and 360 are latitude and longitude grids in each MODIS data
for m = 1:num_files;
deep_aod (:, :, m) = ncread(file_names(m).name, 'Deep_Blue_Aerosol_Optical_Depth_550_Land_Mean');
end;

The above code will create a 3-d workspace variable named deep_aod (360*180*364) in which 360, 180, and 364 represents longitude, latitude, and days of year 2008, respectively.

Calculate average for plotting

% change the dimensions of latitude and longitude to make it more intuitive (we want to see latitude in the rows and longitudes in the columns)

deep_aod_arng = permute(deep_aod, [2 1 3]); 

%bring the time dimension to the front for easier processing
deep_aod_arng_time = permute(deep_aod_arng, [3 1 2]); 

% convert the 3-d data to 2-d data so that we can apply vector operations in MATLAB, the resulting rows represent each day and columns represent each grid points in the entire globe.
deep_aod_arng_points = reshape(deep_aod_arng_time, [364 64800]); 

Upon examining the data files we see that the days 107 and 309 days are missing. So lets insert two arrays in the respective place so that the date represents complete year and it is easier for further processing. 

%create a dummy row of NaN to be inserted

dummy = NaN (1, 64800); 

%insert the dummy row at the respective rows

deep_aod_arng_points_complete = [deep_aod_arng_points (1:106, :);dummy;deep_aod_arng_points (107:308, :);dummy;deep_aod_arng_points (309:end, :)];

Now create a timetable using this data; it will make it very easy for further calculations, for example, for calculating monthly mean.

%first create a datetime array for 2008

t1 = datetime (2008, 01, 01);
t2 = datetime (2008, 12, 31);
t = (t1:days:t2)';

% now create the timetable

deep_aod_2008_timetable = timetable(t, deep_aod_arng_points_complete);

%now lets calculate the monthly mean AOD values using this timetable

aod_monmean_2008 = retime (deep_aod_2008_timetable, 'monthly', 'mean'); %

Plot the data

% To plot the data, we need to read the latitude and longitude data from any one MODIS file:

MYD_lat = ncread('MYD08_D3.A2008001.061.2018031095350.hdf.nc', 'YDim');
MYD_lon = ncread('MYD08_D3.A2008001.061.2018031095350.hdf.nc', 'XDim');

% create a 2-d grid of latitude and longitude to be used for plotting

lat_mat = repmat(MYD_lat, 1, 360);
lon_mat = repmat(MYD_lon', 180, 1);

Now plot data with the below script using geoshow.

h1 = figure('position', [50 50 1200 600]); 
axesm mercator
p = worldmap([-90 90],[-180 180]);
%borders('countries', 'Color', 'black', 'linewidth', 0.75) 
gridm('on');
setm (p, 'mlabellocation', 40); % for reference_longitude
setm (p, 'plabellocation', 20); % for reference_latitude
geoshow('landareas.shp', 'linewidth', 1.2, 'facecolor', 'none')
h2 = geoshow (lat_mat, lon_mat, reshape(aod_monmean_2008.deep_aod_arng_points_complete(1, :), [180 360]), 'displaytype', 'surface');
caxis([0, 1]);        
title('MODIS AOD Jan 2008');
colormap jet; brighten(0.5);
h3 = colorbar;
set(h3,'fontsize', 12);

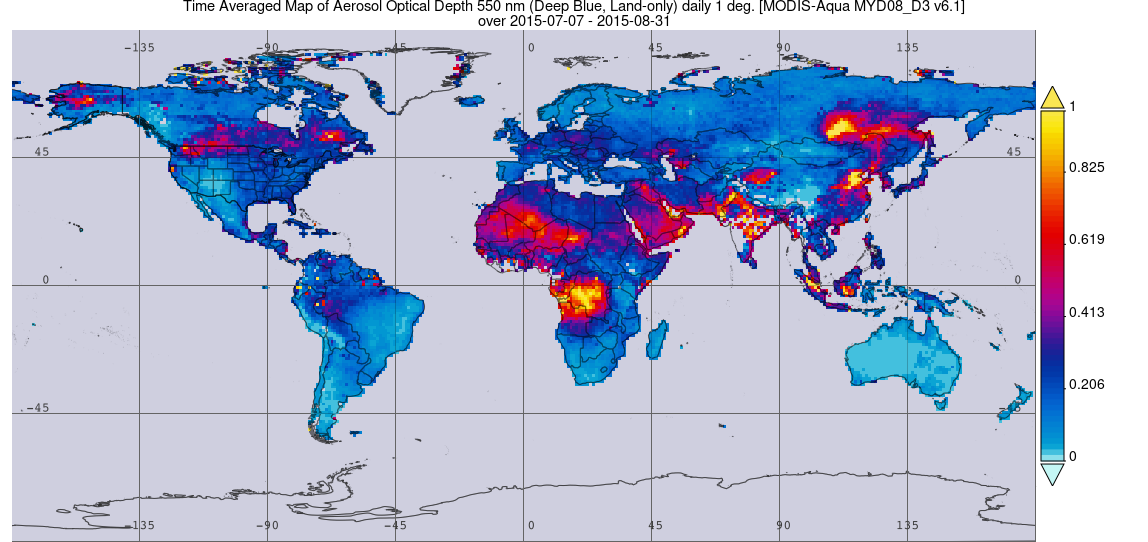
You should get a plot like below:

Note: always verify the accuracy of the plotted data from your intuition or secondary sources. For example, in this case, I know that bodele in central Africa is one of the most active dust source region so it should have high AOD which I can see in this plot.

Thank you!

How to download MODIS aerosol data in NetCDF format?

MODIS data can be downloaded from EarthData portal easily. Remember you have to register and login to download the data. Unfortunately, the data there are available in HDF format like in most other portals. But there is one portal from where you can download processed MODIS data in NetCDF format which can be easily handled in MATLAB and other programs. The name of that portal is Giovanni. Let me explain how you can download MODIS data in NetCDF format from this website:

Example of data visualization from Giovanni.
  1. MODIS data are available in daily/monthly formats from both Terra (MOD*) and Aqua (MYD*) platforms. I will be downloading MODIS Aqua daily (MYD08_D3) data here. Go to the Giovanni website and enter the term MYD08_D3 in the search area. Be sure to login first; the same credentials from EarthData can be used. Enter the required date range. You can download data for the entire globe since data files are not that big. Let the plot be ‘Time Average Map’. After the search, select the desired variable, here I use “Aerosol Optical Depth 550 nm (Deep Blue, Land-only) (MYD08_D3 v6.1)”. Then click ‘plot data’.
  2. In the upper left corner, click ‘lineage’, and go to the heading ‘Data File Staging’. Then click “Download list of all URLs in step” which will download the link of all input files (*.nc) in a text file. If you examine the data links inside the text file, you will see that the input files are in NetCDF format, not in HDF format.
  3. Rename the text file to modis_data_list.txt and copy this file to your unix/linux workspace. Change the permission of this file by: chmod 777 modis_data_list.txt.
  4. Now download the data listed in the modis_data_list.txt by using the command wget: wget –content-disposition -i modis_data_list.txt
  5. The above step will download all the data requested in NetCDF format.

In the next post, I will explain how to process and visualize the downloaded data in MATLAB.

Why air quality matters?

The air we breathe today is no longer the same when we were child. The rapidly increasing industrialization and urbanization has made it increasingly difficult to find fresh air in the cities we live. Even the remote villages are affected because the pollutants are transported downwind within a matter of hours when the meteorology is favorable.

Air pollution is one of the main thing to worry about at the moment globally. Air pollution is what is really killing people. Millions of people are dying every year from respiratory diseases related to air pollution. A research paper published in 2020 in Cardiovascular Research journal estimates about 8.8 million people die prematurely every year around the globe due to outdoor and indoor air pollution. Even in the current context of COVID-19 pandemic, It is a well known fact that more people are dying by COVID-19 because of preexisting conditions related to lung health.

Air quality is a common agenda of all lives including us the human beings. Who would not agree on a policy to reduce air pollution? Who would disagree if we say that we need to curb pollutant emissions to improve the quality of air that we and our children will breathe? We all are affected by air pollution without exceptions. It is our common problem that we must solve together. And fortunately, if we take care of air pollution, we will also solve most of the problems related to global warming and climate change.

So why not focus our attention in solving the problems of air quality? It is indeed the most sensible thing to do. Isn’t it so?

Thank you!

New journal topic launched

We have just launched a new research topic in the journal Frontiers in Environmental Science — Atmospheric Dust: How it affects climate, environment and life on Earth?

Please follow this link to know more details about the topic and article submission procedure.

Frontiers in Environmental Science is a leading open-access journal which is redefining the publication process by easing the bureaucracy of the publication process. It uses a user-friendly manuscript interface for manuscript management. I hope you will consider submitting your upcoming articles in this issue. 

Understanding publication metrics: impact factor and h-index

I was looking for some papers in Google Scholar yesterday and accidentally clicked on ‘Metrics’ icon located on the right side of the page. In front of me was a list of top 100 journals (of the world) based on their h-index. I was surprised to see that most of the journals in the list were in the field of biological sciences, physics, and chemistry. To my dismay, I didn’t see the journal ‘Nature Geosciences’, the most revered (sorry if you don’t like to say so) journal in the field of Geosciences. But do the above results imply that only the ladies and gentlemen in biology, physics, and chemistry publish good research? Does that mean Geo-scientists watch movies all the time?

The answer is certainly “no”.

111

So the question is:

Why the journals in biology, physics, and chemistry have the highest impact factor? 

To answer this question, we have to answer another question first:

What exactly is an h-index?

According to Wikipedia, “A scientist has index h if h of his/her Np papers have at least h citations each, and the other (Np − h) papers have no more than h citations each.”

Little confused? Very reasonable! But it is very simple.

If a scientist has an h-index of 12, it means that he/she has published 12 papers that received 12 or more citations.

The h-index was proposed by physicist Jorge E. Hirsh in 2005 aiming to measure both the productivity and citation impact.

So to maintain a high h-index, you have to keep publishing while maintaining the quality of your publications (so that you receive more citations). If you publish a paper that is eventually not cited, you are wasting your time as it won’t contribute to your h-index no matter how many more such papers you publish. The h-index for a journal also means the same thing.

Now we are in a situation to answer the original question. If a journal has a high h-index, it generally means that it has published higher number of papers that received higher number of citations. But what does that really mean? It simply means that there are more people working in that field so that the probability of number of papers being published (and cited) is higher.

Still doesn’t make sense? Lets look at this statistics here about the number of PhDs awarded in 2008 (of course in the US). The number of doctorates awarded in biological sciences is 7,793 while it is 862 for earth, atmospheric, and ocean sciences. So obviously we can expect more publications in biological sciences, and hence more citations, and hence higher h-index, in the journals of that field. This is not surprising considering the fact that the history of research in biological sciences, physics, and chemistry is much longer than that of Geosciences. I hope I answered the original question.

Unfortunately, h-index is not perfect as is this world. For example, if a scientist published only one paper in his life time that received say 2,000 citations, his h-index is 1. Another scientist who published one paper and received only 15 citations, would still have an h-index of 1. Another drawback of these metrics including the h-index is that they do not reflect the difference among different fields. So the h-index of a journal/professor of biology cannot be compared to the h-index of a professor/journal of Geosciences.

In your Google Scholar profile, you will also see another index called i10-index developed by google, which, in fact, is very similar to the h-index. It is just the number of your papers that received at least 10 citations.

Another frequently asked question:

Do you really need to publish in a journal having a very high impact factor to prove yourself?

The answer is “not really”. Have you realized that the impact factor of your paper may be higher or lower than the impact factor of the journal itself?

According to Wikipedia, the impact factor of a journal in any given year is the average number of citations received per paper published in that journal during the two preceding years. So if a journal has a high impact factor, either the journal received higher number of citations or the journal accepted fewer number of articles, or it could be both. For most of the journals, the acceptance ratio would not be too much different. So the major component affecting the impact factor is the number of citations indeed.

Lets take an example of a paper published in 2013. This paper published in April 2013 has received 25 citations until July 2015. That means the impact factor of this paper is 25. Note that the impact factor of the journal Nature in which this paper was published is 41.45 in 2014. So it can be said that this paper is significantly below average for this journal.

Lets take another contrasting example. This paper has received 50 citations in a similar time period, i.e., between May 2013 to July 2015. This means that the impact factor of this paper is 50. Now compare this to the impact factor of the JGR-Atmosphere journal in which it was published, i.e., 3.43. It means that this paper has significantly higher impact than the journal’s average impact.

So it really doesn’t matter in which journal you publish your paper. The only thing that matters is whether you receive citations or not.

One last question:

What is the best way to measure productivity of a researcher?

There will probably be many indices rolling in the future each claiming that it is the best. But, perhaps the best way to evaluate a researcher’s productivity or performance is to simply look at both the number of citations and the number of publications, both of which are shown by Google Scholar and other academic search engines (if made public). In addition, quality of the paper must be evaluated by a researcher in that field. It is that simple. I am not saying that we don’t need those indices. When making comparison among many candidates, those indices are indeed very helpful. And it is always fun to compare your index with that of your peers in Google Scholar. 🙂

Thank you for reading.

P.S.: The original paper about the h-index can be found here.

The author is thankful to Travis Swanson for helpful discussion.
Powered by WordPress & Theme by Anders Norén