Extreme heat and air pollution kill!

Category: Environment and Climate

How good are our weather/climate models?

Pretty good apparently.

I recently carried out some model experiments using WRF to evaluate how our weather forecasts perform in terms of simulating the diurnal cycle of air temperature and humidity, which are the two key parameters determining heat stress experienced by humans – thanks to our collaborators at National Weather Service (NWS), San Diego.

The NWS provides daily weather forecasts using The Global Forecast System (GFS) for upto 16 days into the future at 0.25km spatial resolution, which can be freely downloaded from the following website:

https://nomads.ncep.noaa.gov/pub/data/nccf/com/gfs/prod/

While the GFS forecast is one key forecast product among several other weather forecasts adopted by the NWS, it is also typically used to drive regional climate models such as WRF at fine resolution using them as initial and boundary conditions. The GFS provides forecast over the entire globe but at a compromised coarse spatial resolution of 25km because of computational constraints. Thankfully, these data allows us to run regional model simulations at fine grid resolution, typically at 1-3km, suitable for making weather forecast and other climate studies on a local scale, which is more relevant to the public. Such fine resolution simulations better resolve the topographic and vegetation details and thus can provide better forecast on a city scale.

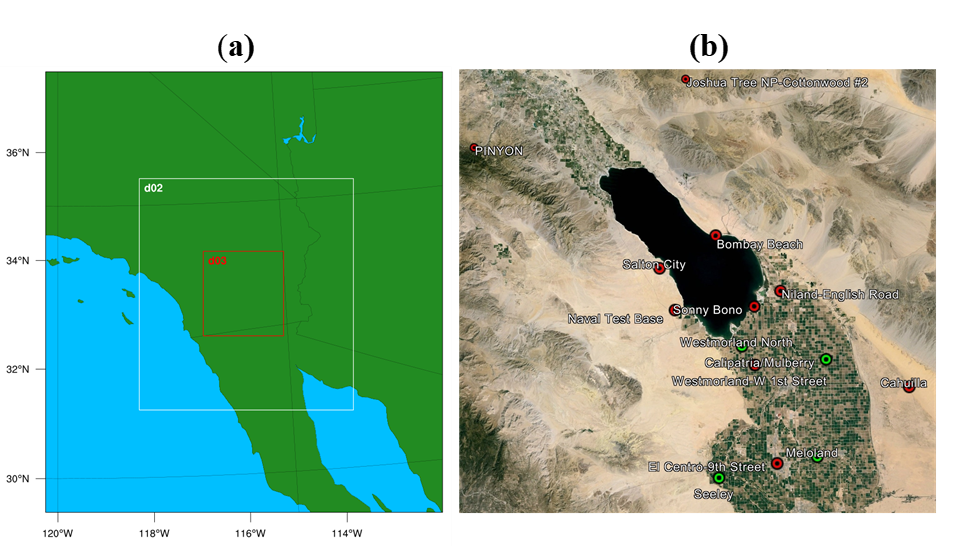
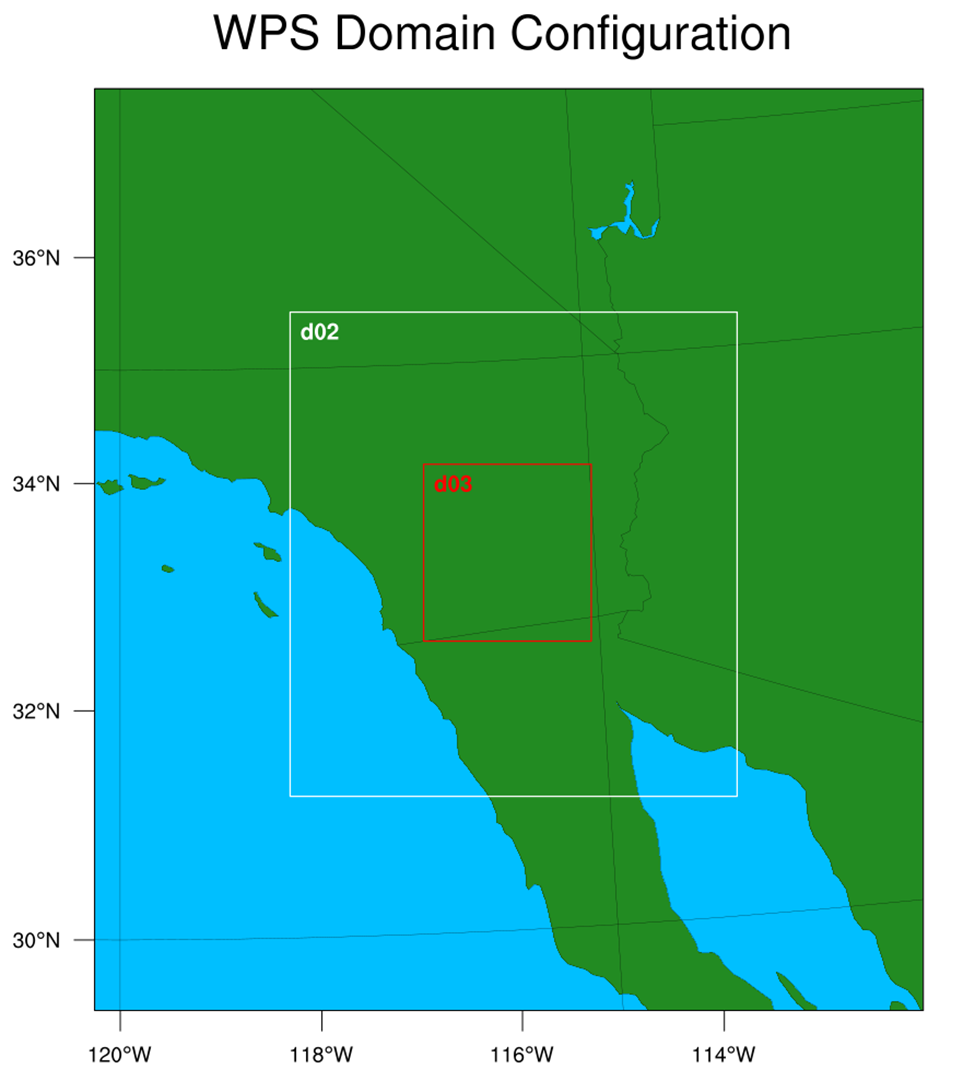
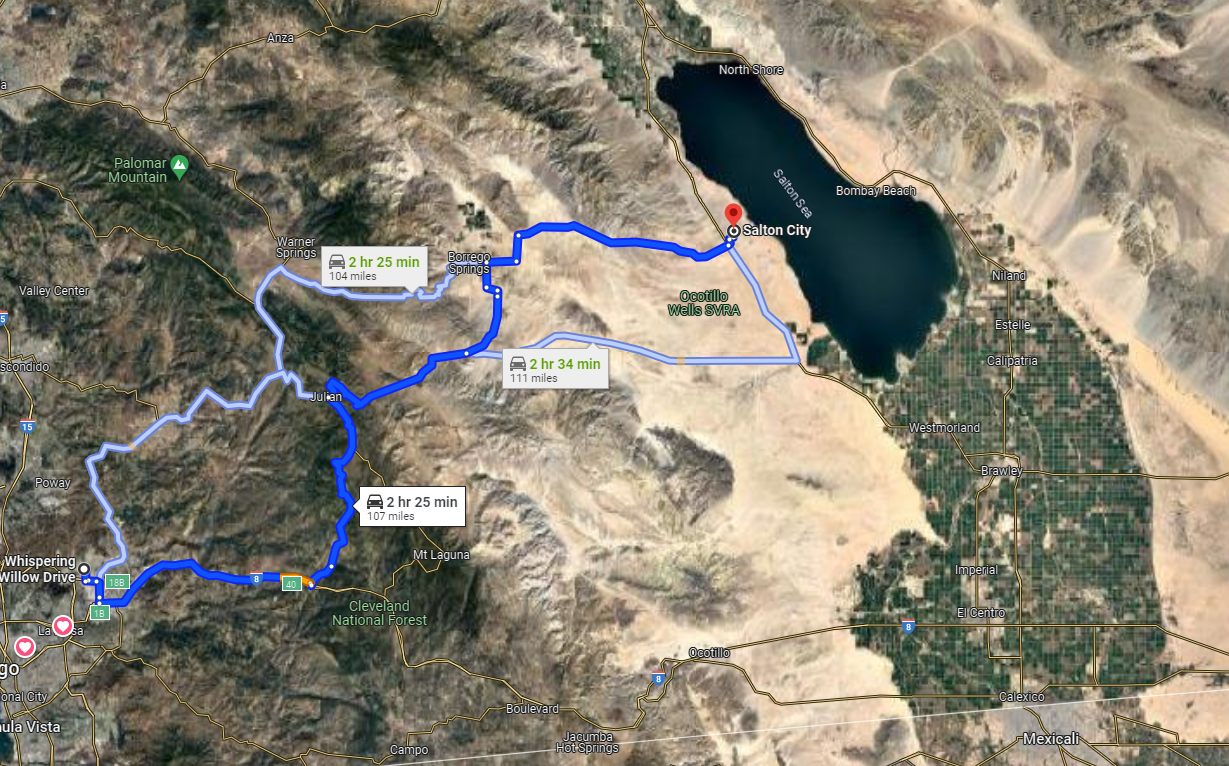
So here is what I did. I basically downscaled the GFS forecast (GFS-25km) using my WRF set-up over the Imperial Valley at 1km resolution and compared the downscaled results with the observations for a recent time period.

Fig. 1. (a) WRF model domain configuration showing the region of interest (d03) over the Imperial Valley and (b) the agricultural regions of the Imperial/Coachella valleys.

I also conducted another set of simulations by using ERA5 reanalysis (ERA5-WRF) instead of using GFS forecast (GFS-WRF). ERA5 reanalysis, which is also a global product at 31km resolution, is not a forecast but a hindcast with a 5-day latency. These reanalysis data are nothing but similar model results calibrated using actual observations so they are supposed to be more accurate.

I compared the above two sets of downscaled results from WRF and the original 25km GFS results with the actual observations recorded at four of our recently installed stations in the Imperial/Coachella valleys. Basicallly, the idea was to see if there is any value of running a high-resolution model at 1-km resolution, instead of just using the original forecast at 25km spatial resolution.

Above I show two figures comparing the above four sets of results in terms of 2m air temperature and 2m relative humidity. Here are my key takes from these results: 

– The diurnal cycle of air temperature is simulated quite well by the 25km GFS forecast in the Imperial Valley region and WRF downscaling doesn’t seem to add much value. 

– The performance of GFS-WRF is comparable to the ERA5 although the latter assimilates observations. The European Centre for Medium-Range Weather Forecasts (ECMWF) also provides similar forecast product at 25-km resolution but they require paid subscription. So, GFS forecast is a clear win here.

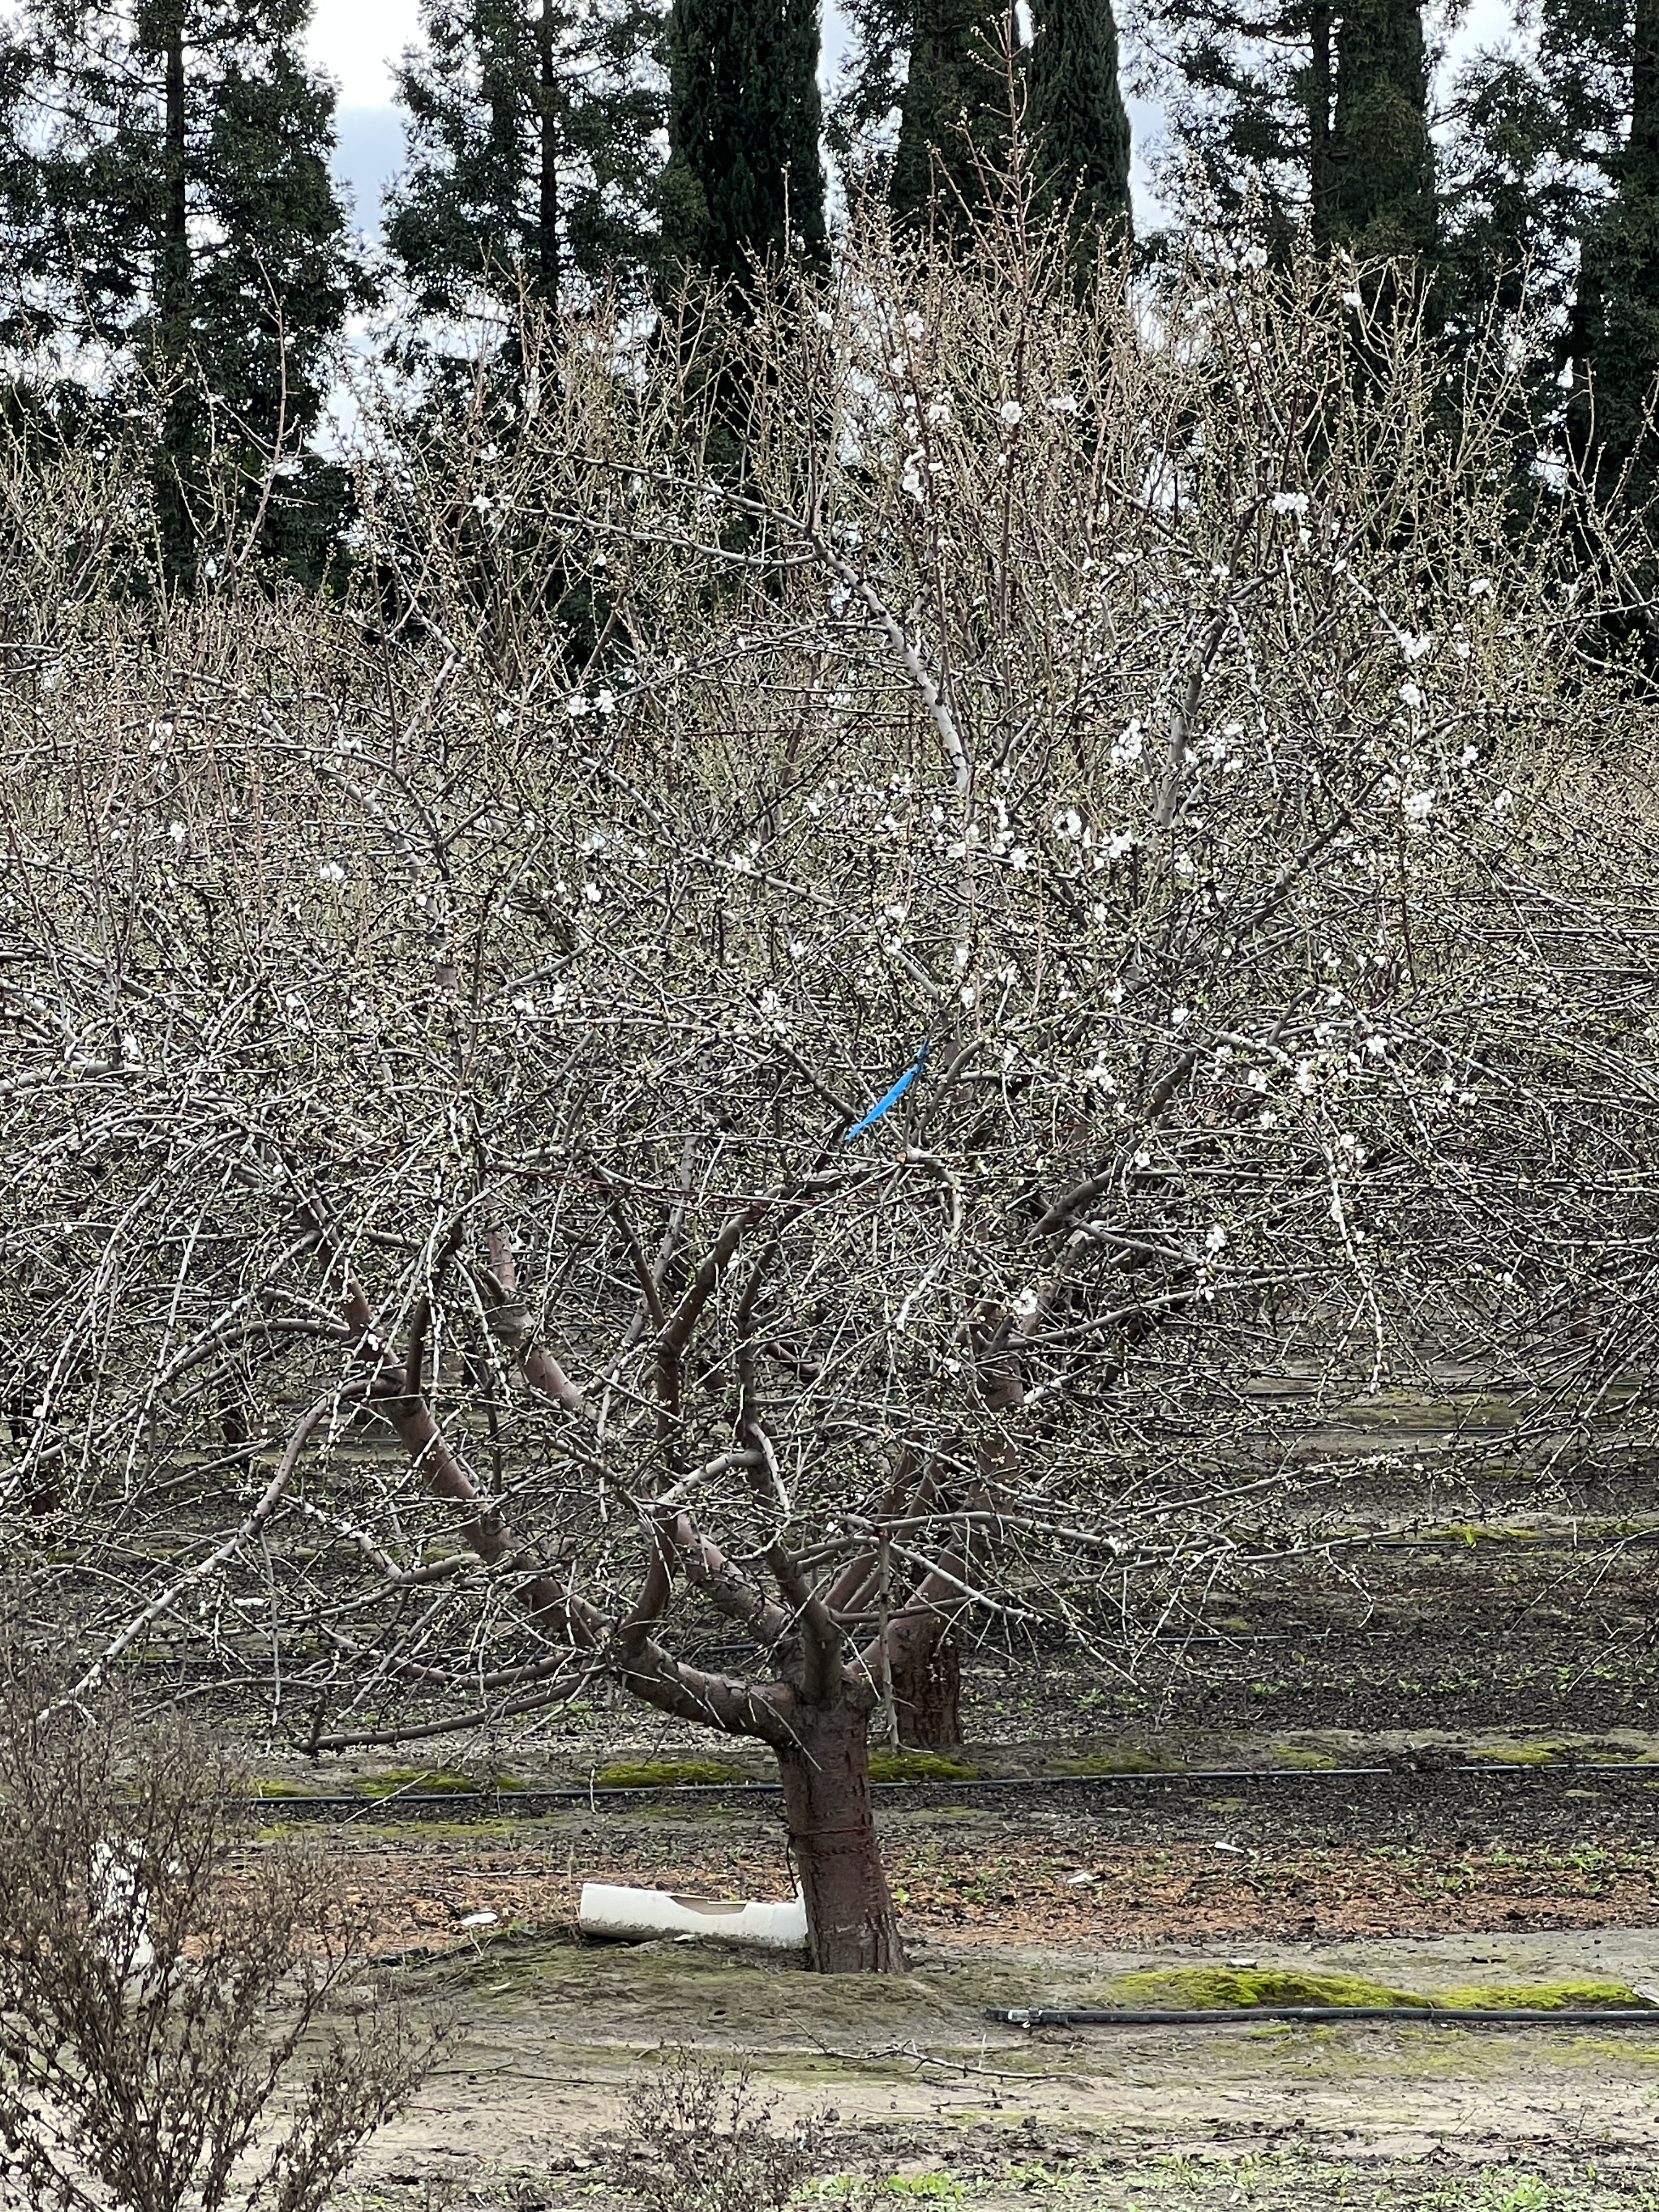
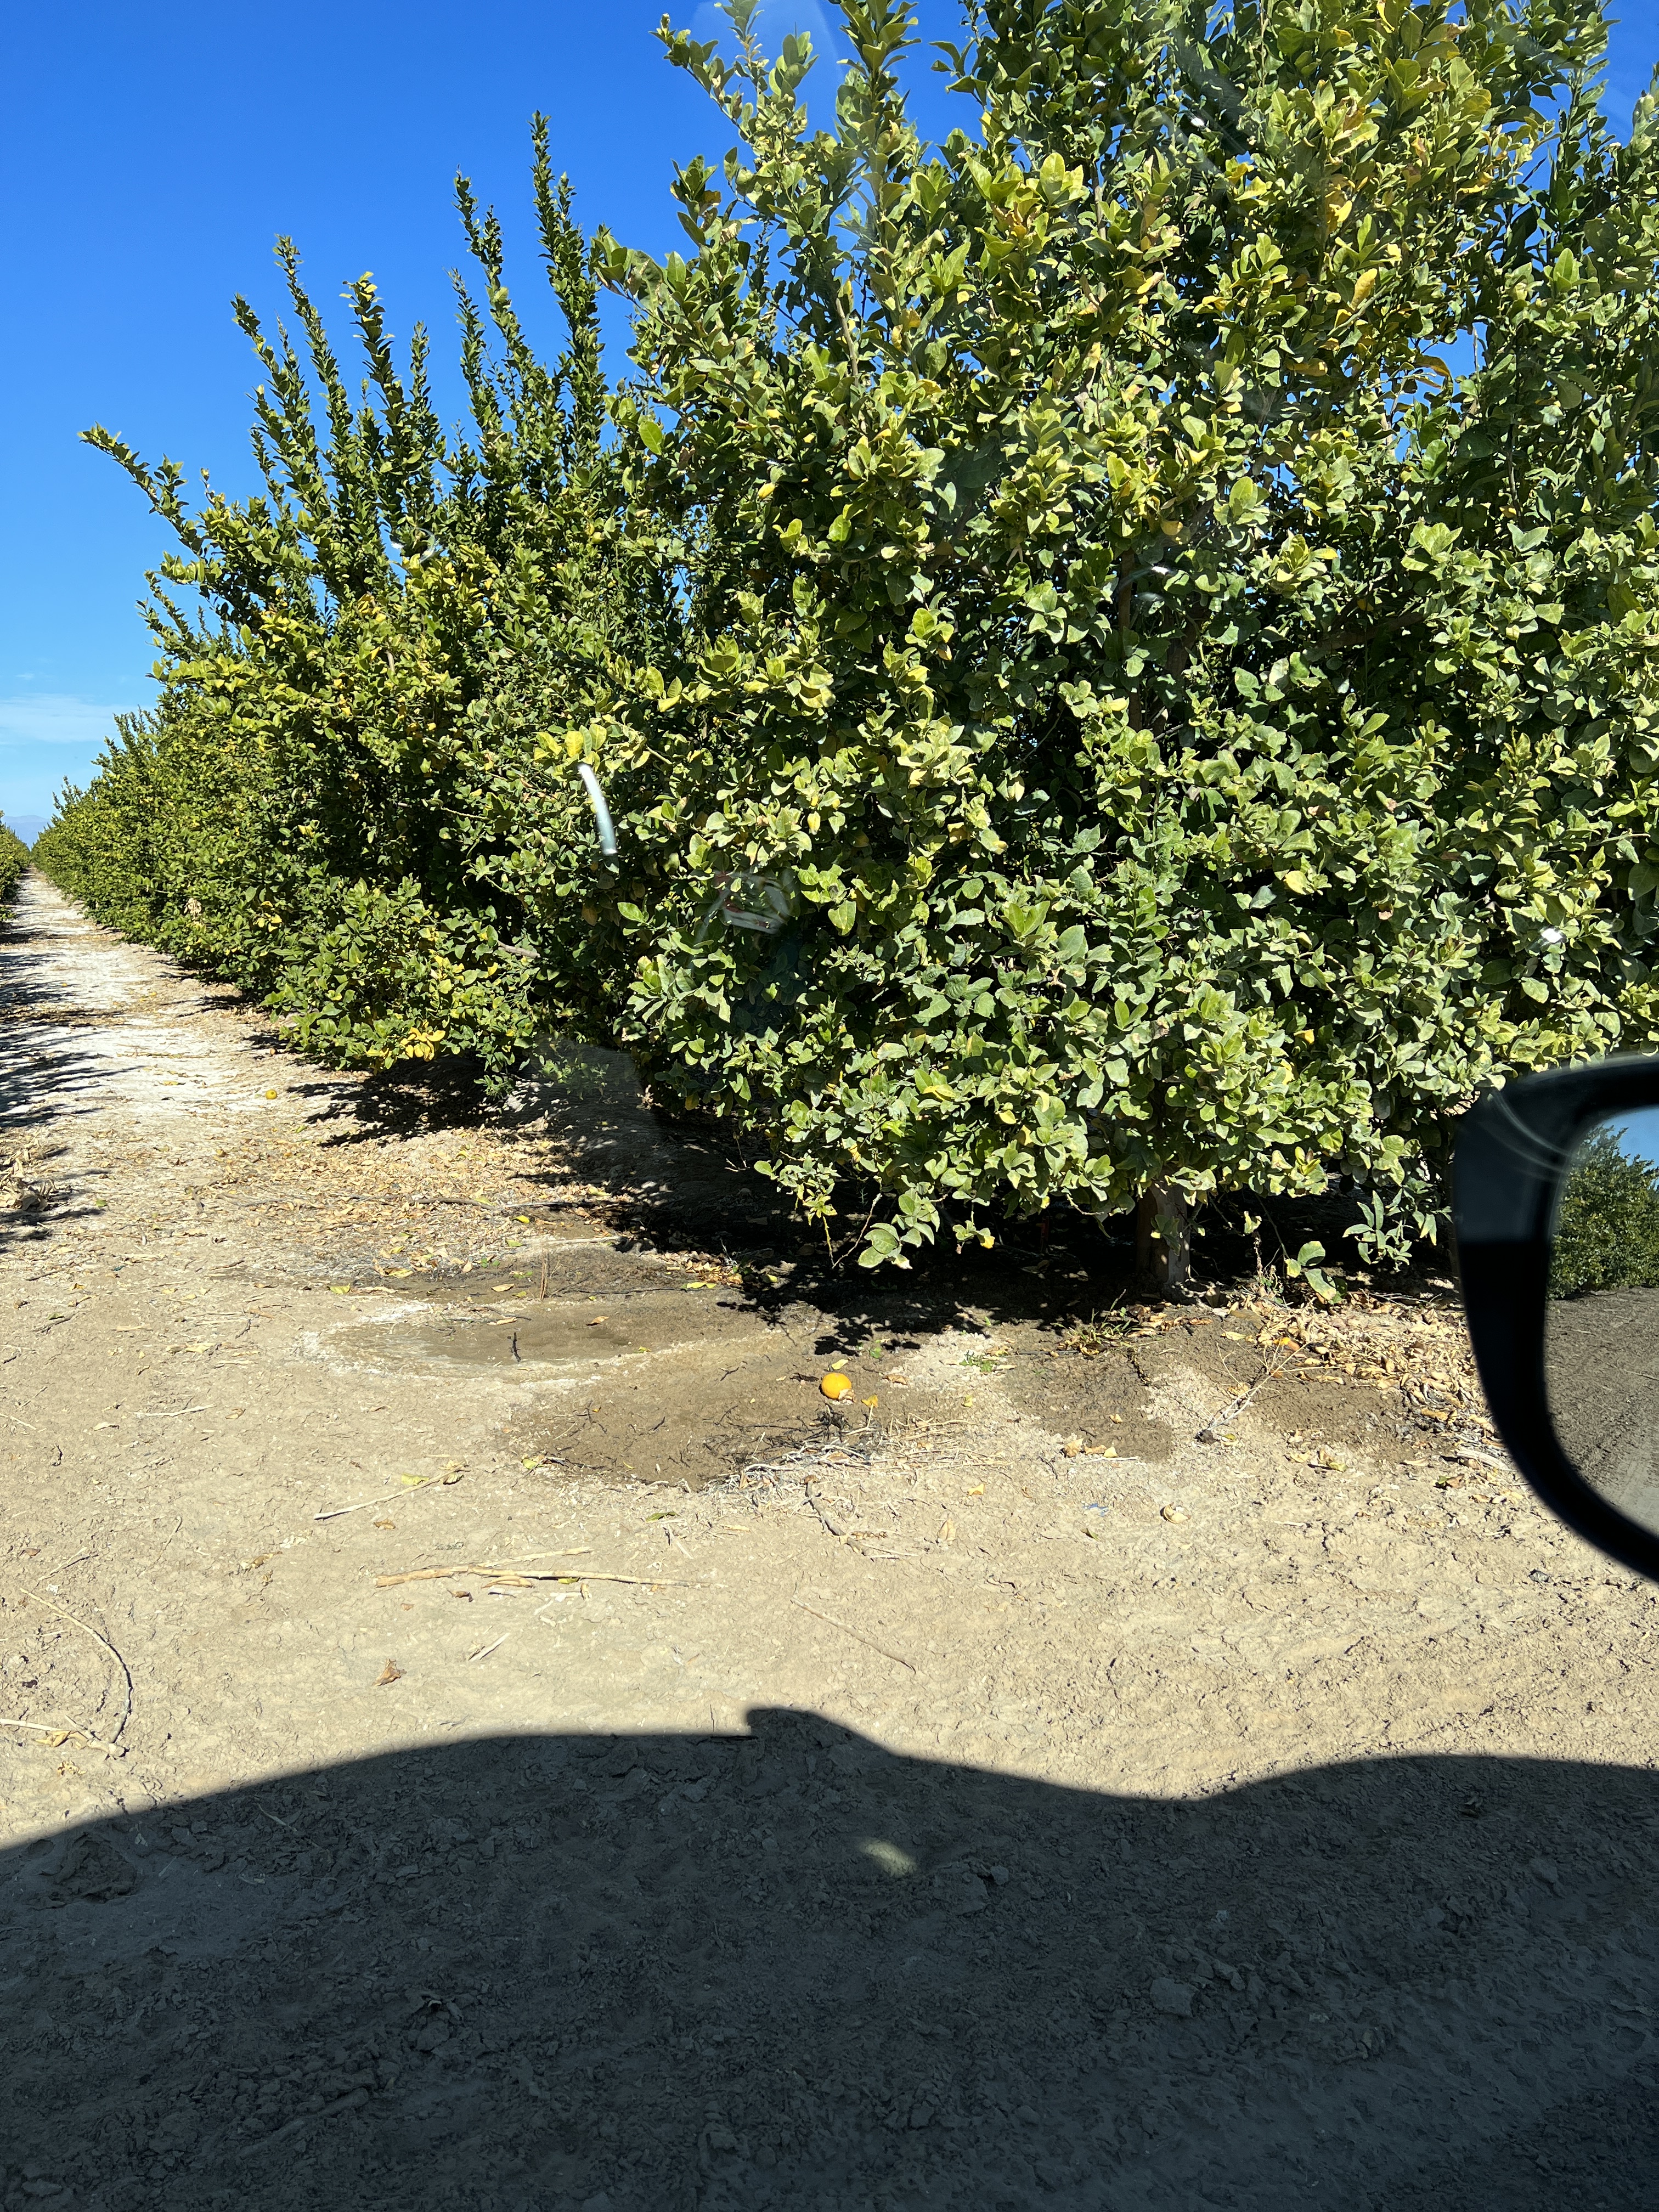
– There is some added value of WRF downscaling in the Coachella date palm region, where vegetation is taller. The GFS forecast underestimated the temperature but WRF did a much better job. This makes sense because tall vegetation clearly plays a strong role in this region in modulating the local weather, whose effect becomes more apparent at higher resolution. 

– In terms of humidity, it seems to be a major challenge in forecasting. WRF downscaling appears to improve it somewhat but there is a lot to work upon in terms of getting the humidity right. 

– Interestingly, the GFS forecast performance does not seem to downgrade with the forecast lead time as one would generally expect. The longer the forecast time into the future, less the reliability of the forecast because the model results depends upon the accuracy of initial/boundary conditions which become more uncertain as we go into the future. As a matter of fact, forecasting diurnal cycle is easier for models because they have repetitive patterns. The main challenge for our weather and climate models is to simulate the non-repeating weather and climate events such as extreme events.

As extreme events (e.g., extreme heat, extreme precipitation, extreme air pollution) are becoming more frequent, prediction of which is much more important to the society, comparisons in terms of extreme climate would be more meaningful. However, such evaluation requires multi-year simulations, and thus requires much more resources, time and effort, which is beyond the scope of this simple investigation.

Thank you for your time.

A fertile trip through the Central Valley to Sacramento

I have lived in the southern edge of California, but the Central Valley keeps coming on my head. It has remained as a place of wonder in my heart too.

Anything that is at the center has power, it pulls you towards it. Central Valley is California’s center. It is California’s womb. Womb is where creation takes place. It is where growth takes place. No wonder, Central Valley produces more than 2/3 of the fruits and nuts consumed in the entire US.

When you truly wish for something, the entire universe conspires to make it happen.

I got invited to Sacramento for an event at the California State Capitol. I took this opportunity to steer through the fertile lands of the Central Valley. But something got my plan changed. I blamed the weather. And I decided to fly to Sacramento, instead of driving. I now planned to drive back, through the Central Valley.

The stormy weather this season lasted almost a week in the first week of February 2024 due to multiple atmospheric rivers. The flight took off on time despite the bad weather. Clouds were beautiful on their own but that is not what I had wished to see. Sierra Nevada mountains were fully covered with snow too. That was still not what I had wished to see. I had wished to see the green agricultural fields of the Central Valley from above. I couldn’t see much. Only a part of the green fields was visible near Sacramento, as the plane descended for landing. Those too, were flooded due to the heavy rain.

I atteded a CCST event at the California State Capitol in the afternoon the same day. It was a pleasure presenting my current research in the Imperial Valley to the Assemblymembers Mike Fong and Christopher Ward. There were othere legislative staff, people from California Energy Commission, California Air Resources Board, and also a astrophysics group from University of California (UC), Santa Cruz attending the event. It was specially enlightening to chat with professor Sandra Faber, an astrophysicst at UC, Santa Cruz, who had interesting views on a range of topics from energy and environment to policies. It was quite an experience presenting my research, repeatedly, in an elevator-pitch style, to multiple people from different backgrounds, packed in a small meeting room at the Capitol.

My return trip started from Oroville. Central valley can’t be understood without looking at its water infrastructures. That is why I decided to start my journey from the Oroville dam, the tallest dam in the US, on the Feather River, north of Sacramento. The dam was built between 1957-1968. To highlight the significance of this project to the entire California, a sackful of gravel and sand was used in the first concrete used in this dam.

My first stop was at the Antioch Bridge that lies in the south of the Sacramento County. This is the place where the northward flowing San Joaquin river meets the southward flowing Sacramento river. Such places are considered auspicious — they are, indeed. A short video clip of the area that I took is here. As I stood on the fishing pier, a useful guide to fish eating captured my attention (included below).

Google map view of the Antioch Bridge. The Sacramento and the San Joaquin rivers can be seen on the left and the right of the bridge.

After seeing the Antioch Bridge area, I headed south through the Byron highway. I stopped near the UC Davis Fish conservation center to see the beginning part of the California Aqueduct in the Sacramento-San Joaquin river delta, which was built to supply water from the northern California to the southern California. This was an engineering masterpiece because it involves pumping of water against gravity by huge pumps and dumping the water to the distribution aqueducts and canals. At the moment, these canals and aqueducts never run to their full capacity because the federal and state regulations now restrict pumping of water from the delta region to protect the endangered delta-smelt and other local fish species.

The green meadows on the little hills seen in the west of the Byron highway were spectacular. The view definitely reminded me of the natural beauty of Switzerland. The US as a country is huge and it indeed has so many beautiful landscapes waiting for us to explore.

I intentionally took California highway 99 avoiding the more usual I-5 route, although it would take much longer time to reach San Diego. As I drove through the Central Valley cities of Modesto, Merced, Fresno, and Tulare, I saw several railway lines that ran through the cropfields. Most of them were part of the Union Pacific railroad, which is the second largest railroad in the US. This centuries-old railroad network which was first built in 1806 made it possible to transport the excess produce of the Central Valley to the rest of the US. There are probably other smaller trolleys as well operated by the individual farm owners in the central valley.

Union Pacific trolley as seen from the Byron highway.

There were crop fields on both sides of the highway. I drove for hours through these fields while stopping occasionally to take some pictures. The almond trees were just beginning to flower. I couldn’t really tell whether they were amond trees or peach (apricot?) trees because I know that both of them look similar. We had a lot of peach trees in our village so I can recognize them. But it is hard to tell what it is in this flowering season.

At the end of the crop fields near Bakersfield, the green medows looked spactacular on the west side of highway 99. I also saw a huge water pumping station (visible in the picture below). It was State Water Project’s Wind Gap pumping plant, the last major water lift from the California Aqueduct over the Tehachapi Mountains, which was renamed the Ira J. Chrisman Wind Gap Pumping Plant in his honor. 

https://images.nationalgeographic.org/image/upload/v1638892259/EducationHub/photos/replumbing-california.jpg

When I looked on the left, the Sierra Nevada mountain was smiling with considerable amount of snow.

The history of California is so intriguing. The Central Valley was transformed from desert to a rich land producing fruits, nuts, and vegetables some 100 years ago. Engineers built one of the most complex network of Aqueducts to irrigate the Central Valley farmlands. Dams were built, canals were laid, wells were digged. The California Aqueduct that begins at the Sacramento–San Joaquin River Delta was built in 1963. That is well before our era of computer and internet. We are living in the 21st century, but infrastructure-wise, we are only enjoying what our ancestors built. We haven’t built anything such significant in our times. Of course we have done a lot in the IT and computing sector.

The older generation got busy working. They got busy building and growing. They developed and used technologies that defied even the worst droughts. They adapted. They adapted from one crop to another. From rivers to wells. From west to east.

Central Valley farmers used technology as it became available to foster their yields. They knew all the details, when to plant, how to plant, and even how to better pollinate. To them, it didn’t matter, whether water was available or not. It didn’t matter whether soil was good or not. They grew pistachios when the water was saline. When winds didn’t blow, they knew how to pollinate. They knew how to make the fruits puffy too.

I am ever fascinated by its story of transformation. California is a miracle. Not a single person made it. But it has only known growth from the very beginning. It has never remained. And will never stand still.

Many things in California happened more than 200 years ago. California developed, flourished, and a part of it even got perished much before we were even born. California has always been in a rush, from gold rush, to water rush, to now lithium rush.

California still looks beautiful as it moves, and transforms. It is wonderful to live here and be a witness of California’s growth. California is indeed unbeatable.

California is not just about Silicon Valley

California is not just about Silicon Valley; it is the Central Valley and the Imperial Valley (IV) that truly define California’s richness, as they produce more than half of the fruits, vegetables, and nuts consumed in the United States. The Imperial Valley, which lies on the south side of the Salton Sea, alone provides more than 80% of the nation’s fresh winter fruits and vegetables. But have you ever wondered how those succulent oranges, almonds, and lettuces come to your table every day?

An overview of the Salton Sea/Imperial Valley region. Picture courtesy of USGS: https://eros.usgs.gov/earthshots/imperial-valley-california-usa

Unfortunately, the farm workers in the Imperial Valley experience a high number of cardiovascular diseases due to heat stress. Not only this, the IV region is recently going through tremendous environmental stress due to water and air pollution; extreme droughts and flooding; and land use change.

I have built a high-resolution, high-performance regional climate model set up around the Imperial Valley (WRF-IV) that can be used to address such environmental concerns. As an example, the model can simulate how the microclimate will change when croplands are converted to solar fields. Similarly, the model can be used to calculate the heat stress experienced by farm workers at a specific time and location.

What question intrigues you the most about this region? 

A short trip to Salton Sea and Imperial Valley

I wanted to end my holidays by paying a visit to my research site, the Salton Sea and the Imperial Valley. The GPS took me through highway 79, which was one of the windiest road I have ever driven in the US.

A quick video of Lake Cuyamaca

One of the main attraction en route was the Lake Cuyamaca Recreation park. People were fishing and having fun at the park. It was chilling cold though for me having come from Santee. It is indeed one of the best camping site, which I will consider for the future. Borrego springs and Anza-Borrego Desert State Park are two other attractions en route which are a few miles west and east of the highway.

After the winding road ended, there comes the flat land of Ocotillo Wells State Vehicular Recreation Area, which is a popular camping site. Before I reached the site, I saw dozens of RVs coming from the opposite direction and I was wondering from where they were coming. Then I passed through the Ocotollio Wells camping area and realized those were the people who camped in the area and were returning home after celebrating the new year outdoor. It was January 2 so it made perfect sense.

One of the bizarre site I came across while heading to Westmoreland was the Republic of Slowjamastan. I became so curious after I saw a big signboard with such a name because of the key words ‘republic’ and ‘slojamastan’, which sounds a bit russian. The board clearly seemed eccentric to the California land. I googled about it later and knew that it was a micronation declared by an individual, which has become a humorous and symbolic attraction at least if not more.

Then I headed to the Salton Sea near the Salton City. I was determined to touch the water of Salton Sea today so I explored several off roads going to the Salton Sea and I finally found a dirt road which went straight to the sea through the marshlands. I stopped my car some 100 feet away from the sea shore and headed to the Sea. A few birds were the only living creatures other than myself around. The water was somewhat clean, not what I had expected at the least. It probably gets dirter in summer and the foul smell would also be more severe by then. In this winter time, the Salton Sea looked quite nice and clean. It was not a beach so I had hard time walking on the spongy land but I was able to touch its water, which was warm, a peculiar characterstics of the Salton Sea.

A close-up view of the Salton Sea Shore

Upon my return, I visited a few farms such as Bee Sweet Citrus and Three Flags Ranch. They were mostly growing Lemon, Pomelo, and Date Palms. I was so curious to see these farmlands that I didn’t care the signs ‘no trespassing’ at all and kept driving through these orchards.

A view of Lemon orchard east of highway 86 near naval base.

Then I came across the famous Alfalfa fields, as I passed through the Forrester Road S30 towards the south. Alfalfa is the protein-rich plant used to produce hay for the cattles. The hay gets exported to the dairy farms across California and as far as Japan and Saudi Arabia. I was seeing these fields for the first time. Most of the Alfalfa was already harvested and stacked ready to be transported. But some nearby fields were already growing another round of Alfalfa. When I entered the fresh young Alfalfa fields, it was very muddy because Alfalfa is often flood irrigated. As a matter of fact, Alfalfa is one of the most water-intensive plant. The farmers were using the water from the nearby canals.

Other than Alfalfa, I mostly saw spinach and turnips growing there.

I enjoyed chicken tacos (always corn option for me) in a local Chevron store in Westmoreland.

Upon my return, I passed through a solar field, the Tenaska Imperial Solar Energy Center South, a 130 MW solar field, developed by the Tenaska Energy company in 2013. It begins right after the Alfalfa crop fields after the Foxglove canal and extends on both sides of the I-8 commonly called as the Kumayaya highway.

Teneska Solar Field.

There are several other solar fields in the region. Another big solar farm is the Mount Signal Solar farm (794 MW) which is located right next to the US-Mexico border, west of Calexico, which was developed by 8minute Solar Energy, an American photovoltaic (PV) developer. It was built in 3 phases between 2014-2018. This solar farm is clearly visible in the high-resolution Leaf Area Index (LAI) data (Figure below, marked with red circle) that I am using in my WRF model to simulate the effect of land use changes on the microclimate of the Imperial Valley region.

I took a different route for my return along I-8, which was a beautiful scenic drive through rocky hills. I also went to Lake Morena which was some 5 miles off the highway. This site is linked to the famous rainmaker of the 20th century Charles Hatfield, who was known to make rain by mixing and burning various chemicals into the air. His recipe was top-secret, only known by him and he took it to the grave. Charles and his brother set up their rainmaking tower beside the Morena Reservoir and supposedly got to work in 1916.

View of Lake Morena.

I wanted to drive all around the Salton Sea and the Imperial Valley to see all the interesting land use changes happening there but time was not enough in this trip. That will be the plan for my next trip to the region.

Useful links

Learn about Multilevel Models

How weather models work?

A good discussion forum focused on the issues of climate

Know some limitations of weather prediction models

what a Nobel Prize winner has to say on climate change

A cool animation of global wind patterns

Visualize present and future weather data at Ventusky

Live animation of true color GOES image over California

Some cool videos in science

Some climate change lessons and videos from Pacific Institute for Climate Solutions

Know about climate model resolution from this GFDL page

Visualize vectors and mathematical function

Learn about Navier-Stokes Equations

Some interesting papers in Climate:

Global climate model violate scaling of the observed atmospheric variability

Research resources:

How to write a great research article? Tips from this Nature page

Data analysis and visualization:

Data visualization with NASA/Giovanni tool for several available model and reanalysis datasets

Latest data visualization tool, similar to Giovanni but more powerful: Climate Engine

Powered by WordPress & Theme by Anders Norén